|
Having trouble reading this email?
Download the PDF.

Thematic Focus: Resource Efficiency, Harmful Substances and Hazardous Waste
Gas fracking: can we safely squeeze the rocks?

Hydrological fracturing techniques have made accessible vast unconventional gas reserves. However, observed impacts on the environment and human health raise
legitimate public concerns. The potential climate benefits of coal-to-gas substitution are both less clear and more limited than initially claimed. The question of
whether to allow or ban gas fracking needs to be carefully assessed by relevant authorities. A review of current related policies and regulations is critically needed.
Why is this issue important?
Fossil fuels are the world's main source of energy, accounting for 81% of global primary energy use in 2010 (IEA, 2011). However, as
conventional reserves are depleted (IEA, 2010) and demand for energy rises, there is increasing pressure to exploit unconventional energy
sources (UNEP, 2011a; UNEP, 2011b). Hydraulic fracturing (or fracking) is a gas extraction technique used in low permeable rocks. This is
referred as unconventional gas (UG) production. UG has triggered both strong opposition and heightened economic interest.

Figure 1: Technically recoverable shale gas reserves in trillion cubic metres (tcm) in the top 18 countries.
Data source: Royal Society, 2012; cartography by UNEP/GRID-Geneva.
Full Size Image
There is enough UG world-wide to increase gas from 13% of global energy resource base in 2009 to 25 % in 2035 (IEA, 2011; IEA, 2012), ranking gas as the
second most important source of exploitable energy after oil (IEA, 2012). As the geographic distribution of UG differs from
that of conventional fossil energy resources, it changes the dynamics of the international geopolitics of energy (Milosevic and
Markovic, 2012). Countries which are largely dependent on foreign imports to meet their energy supply might look at local UG as
one way to decrease their dependency. In several cases, the development of UG would enable certain countries to achieve greater
energy independence, making the exploitation of UG reserves highly attractive to some governments.
While offering economic and energy security benefits, UG production presents considerable environmental risks. These range from
potential water and soil contamination from surface leaks or from improperly designed well-casing, to spills of improperly treated water,
increased competition for water usage, and fugitive emissions of gas with implications for the global climate. A number of other issues,
related to environmental degradation, can also occur including air pollution from volatile contaminants, noise pollution, negative impacts
on ecosystems, biodiversity losses and landscape disruption.
Proponents of UG development present it as a cleaner alternative to coal that could reduce greenhouse gas (GHG) emissions (Burnham et al., 2011).
However, this assertion has been increasingly challenged by a number of recent studies showing both less clear and more limited benefits than
initially claimed (Wigley, 2011; Hultman et al., 2011a; Howarth et al., 2011b). Ultimately the question of coal-to-gas substitution is a misguided
debate, as none of the scenarios leads to satisfying results to limit global warming. Comparisons should be made with other alternative energy
such as hydro, solar and wind.
What is unconventional gas?
Both conventional and unconventional gas are natural gas - what differentiates the two are their geophysical locations and how they are
extracted. While conventional gas (CG) is located in permeable rocks and can escape freely after drilling, UG is trapped in insufficiently
permeable rock formations, such as shale, tight sands and coal beds (also called coal seam gas in Australia), that need to be fractured in
order to release gas in commercial quantities. Hydraulic fracturing, often shortened to fracking (or fraccing), is a process that injects a
large amount of fluids (water with chemicals and sand) at high pressures into rock formations to fracture them, enabling compounds such as gas
that are held tightly inside to be released (IEA, 2012). These techniques have generally only been economically viable since the mid-1990s,
but have recently become even more appealing (Arthur et al., 2008). A combination of factors, including technological advance, desire to decrease
dependence from foreign energy, new geopolitical realities (Milosevic and Markovic, 2012) and high oil prices, have made unconventional gas and
subsequently hydraulic fracturing particularly attractive.
Most of UG is trapped deep inside of shale formations (shale gas) at depths between 1500 to 3000 metres (Boyer et al., 2006). A typical
horizontal well has an average lateral extension of 1400 m (maximum of 3000 m) (Santoro et al., 2011). The rock is hydraulically fractured
multiple times every 100 metres along this horizontal extent (Figure 4). These fractures can extend between 150 and 250 metres perpendicularly
from the horizontal well and should, in theory, not propagate vertically more than the thickness of the gas-producing layer. Several horizontal
lateral bores can extend from a vertical well (Santoro et al., 2011).
Coalbed methane (CBM), also known as coal seam gas, coalbed gas, or coal mine methane, is methane held within the solid matrix of coal
seams, usually located in shallow geological settings in comparison with shale. Depths of 800 to 1200 metres are typical, but CBM can
also be found at as little as 100 metres below the surface. In such shallow settings, it is more economical to drill using several
vertical wells rather than horizontal wells, resulting in multiplying the number of wells and thus having a larger footprint on land.
Exploitation of CBM may lead to higher venting (gas freely released into the atmosphere) of methane as compared with shale gas and being at
shallower depth, requires higher caution to avoid infiltrations in the water table (IEA, 2012). Water is also often present in CBM and needs to be
removed. This "produced" water must be properly treated and disposed of, so as to prevent spills and land or soil contamination.
World reserves
As of 2010, world production of UG was about 472 billion cubic metres (bcm), 89% of which is produced in North America (USA: 76%; Canada 13%)
(IEA, 2012). However, this resource is widely available globally (see Figure 1) estimated total technically recoverable reserves amount to 420
trillion cubic metres (tcm), with shale gas estimated at 208 tcm, tight gas at 76 tcm and CBM at 47 tcm.

Figure 2: Global remaining technically recoverable gas by types in per cent (left)
and by types and regions, in tcm (right). Data source: IEA (2012); graph by UNEP/GRID-Geneva.
Full Size Image
Unconventional gas accounts for 44% of total possible gas production with existing technologies, shale gas representing two-thirds of
UG sources or 28% of total technically recoverable gas (IEA, 2012). While Eastern Europe, Eurasia (incl. Russia) and the Middle East are estimated
to hold 61% of CG, these regions account for only 16.6% of UG; all the other regions have a larger proportion of UG as compared with CG (Figure 2).
Due to this distribution, growing development of UG reserves will create a shift in global energy supply.
Due to population growth, increase in individual demand, new demand from emerging economies and depletion of oil reserves, global demand for gas
may grow by 45% to 50% by 2035 (IEA, 2012; Howarth et al., 2011a), and according to IEA, the production of UG could more than triple to reach
1600 bcm per year, with the new largest developments expected in Australia, China, India, Indonesia and Poland. UG could rise from 14% in 2010 to
32% of gas production by 2035 (IEA, 2012). Despite these prospects, UG faces an uphill struggle in gaining public acceptance and, given public
health and environmental concerns, UG's future potential may be limited and thus only increase marginally (IEA, 2012).
UG effects on the global climate
The evaluation of GHG emissions linked to UG production is a major point of contention and is the subject of a number of conflicting studies
(Wang et al., 2011, Ridley, 2011 and Howarth et al., 2011a). Proponents highlight UG's lower GHG emissions in comparison with coal (IEA, 2012;
Burnham et al., 2011). However, this assumption is being challenged by other research scientists who are stating UG may be on par or may even
exceed the impacts of coal emissions on climate, mostly due to larger fugitive methane emissions (Wigley, 2011; Hultman et al., 2011;
Howarth et al., 2011b).
Comparisons between UG and coal may be misleading, as new sources of energy, such as UG, would better be compared with other non-conventional
sources of energy such as wind or solar. UG life-cycle GHG emissions are much higher than wind power: 500 g-CO2 per KWh, compared to 30 g-CO2 per
KWh (McCubbin and Sovacool, 2011).
Ultimately, the overall effects of UG developments on the global climate may be limited (Wigley, 2011), and are contingent on several factors (See Box 1).
To have a small to medium chance of achieving the +2°C global temperature target, CO2 emissions from energy and industry must be reduced on average by
3.2 to 3.6% per year between 2020 and 2050 (i.e. -48 or -54% reduction in CO2 equivalent emissions) (UNEP, 2010). Even with large investments and
developments and under best practices, UG production may lead to only 1.3% reduction of GHG emissions by 2035 (IEA, 2012). Investments in UG
development are facing large and increasing public opposition. Hence, the development of UG production globally may remain much lower and have
even smaller impacts on the GHG emissions (IEA, 2011).
Box 1: Specific questions regarding possible UG effects on global climate
|
Whether UG will induce a decrease or an increase in GHG emissions is contingent to several conditions.
Short or long-term view?
The 100-year horizon is commonly used for impacts on climate change; however, given the need to reduce GHG emissions in the coming decades, it is also
critical to assess the 20-year horizon (Howarth et al., 2011 b). Methane (CH4) is a more potent GHG than CO2 - albeit over a shorter lifetime. When
methane is released in the atmosphere (venting), its Global Warming Potential (GWP) is up to 72 times higher than CO2 over a 20 year period, but then
gradually decreases so that over a 100 year horizon its GWP is 25 times higher than CO2 (IPCC, 2007). Recent studies found that emissions from UG could
initially lead to an increase in climate warming in a 20-year horizon and would only be comparable to coal over a 100-year time horizon (Wigley,
2011; Hultman et al., 2011; Burnham et al., 2011; Hayhoe et al., 2002).
What are the average emissions of methane from UG production?
Methane leakage (venting) can significantly reduce the life-cycle benefit of gas compared to coal or petroleum (Burnham et al., 2011). The
production of UG without methane venting is technically feasible (IEA, 2012), however in practice, compilation of data revealed a high
level of methane vented (Wigley, 2011; Hultman et al., 2011; Howard, 2011).
The advantage of UG GHG emissions versus coal highly depends on the percentage of methane vented and the time horizon considered. A
theoretical value of 2-3% of methane emissions (IPCC, 2007) and a 100-year time period are typically used (blue point in Figure 3);
however, observed emissions ranged between 3.6 to 7.9% (Howarth et al., 2011 b).
Such levels of GHG bring UG emissions to a par with coal over a 100-year time horizon (range a) and largely exceed them if a
20-year time horizon is considered (range b).

Figure 3: Comparative of UG versus coal under different time horizons and different levels of methane venting.
Full Size Image
Would UG be a substitute or be used in addition to energy from coal?
Given the increase in energy demand and in absence of pressure to reduce the use of all forms of fossil fuel, UG might not be a substitute
but may add to the energy produced from coal (Wood et al., 2011).
Do investments in UG development compete with greener energy development?
IEA foresees a possible US$ 6.9 trillion investment to develop UG by 2035. Effects on climate of this investment in UG should be compared
with effects of similar level of investments in cleaner energy. Indirect impacts on the climate should also be studied. UG opponents fear that large
investments in UG will come at the expense of more environmentally-friendly alternative energies, such as solar, wind, tidal, geothermal and
secondary biomass energy sources, all of which carry high up-front investment costs.
|
Environmental and health concerns

Impact of unconventional gas extraction on the landscape.
|
UG exploitation and production may have unavoidable environmental impacts (see Figure 4). Some risks result if the technology is not used adequately,
but others will occur despite proper use of technology (EU, 2011). UG production has the potential to generate considerable GHG emissions,
can strain water resources, result in water contamination, may have negative impacts on public health (through air and soil contaminants;
noise pollution), on biodiversity (through land clearance), food supply (through competition for land and water resources), as well as on
soil (pollution, crusting). The sections below further outline the potential environmental and health impacts.

Figure 4: Schematic representation of infrastructures and potential impacts. Source: UNEP/GRID-Geneva, 2012.
Full Size Image
Risk on public health

Pools of Fracking fluid located few miles away from residential area.
|
When occurring in densely populated areas, UG production raises several specific threats to well-being. The most direct concern is the risk of
explosion from the construction of new pipelines (Rahm, 2011). Other consequences have a slower onset, such as release of toxic substances into
air, soil and water. In Texas, emissions from shale gas operations are being checked for contaminants after blood and urine samples taken from
household residents near shale wells revealed that toluene was present in 65% of those tested and xylene present in 53% (Rahm 2011). Both of
these chemicals are commonly present in fracking fluid and known for being toxic. The biocide substances which are also contained in fracking
fluid, and may be released during surface water leaks, can lead to serious damage to the surrounding habitat (IEA, 2012).
More common nuisances include noise pollution, primarily associated with drilling and fracking (which is a non-stop operation over
several weeks), but also from truck transport (Rahm, 2011).
Fracturing fluid consists of large amounts of water mixed with chemicals and sand. In most countries the chemicals used in fracking fluid are
considered trade secrets (Zoback et al., 2010). If companies are not required to publicly disclose the full list of chemicals used, assessing
potential short- and long-term impacts on public health will be difficult. Colborn and others (2011) compiled a list of products (about 1000)
used in fracking fluid. They carried out literature review on 353 chemicals and found that "more than 75% of the chemicals could affect the
skin, eyes, and other sensory organs, and the respiratory and gastrointestinal systems. Approximately 4050% could affect the brain/nervous
system, immune and cardiovascular systems, and the kidneys; 37% could affect the endocrine system; and 25% could cause cancer and mutations."
(Colborn et al., 2011).
Nonylphenol, for example, which is commonly used in fracking fluid, mimics estrogen, and can cause the feminization of fish, even at concentrations
not detected by normal monitoring of the fluid (NYS-WRI, 2011). The consequence of the feminization of fish is an imbalance between male and female
populations, resulting in a deficit of fertilization and potentially leading to a rapid decline of these fish populations.
Footprint on land and natural environment
The connection between wells and seismic activity is a controversial issue (Sminchak et al., 2011). Although a link between injection wells
(such as used in UG) and high-magnitude earthquakes is unlikely, it cannot be ruled out completely (Cuadrilla Resources, 2011; IEA, 2012).
Fracking techniques, just like dam building and the injection of water for geothermal energy production, are known to have a potential to
impact the local seismicity. In Oklahoma, seven hours after the first and deepest hydraulic fracturing stage in Eola field (Garvin County),
50 earthquakes of small magnitude (1 to 2.8 Md) occurred within 3.5 km from fracking sites. Changes in fluid pressure at well bottoms were
sufficient to encourage seismicity. Correlation (in space and time) doesn't mean causality, but remains a "strong possibility" (Holland, 2011).
As such, an in-depth assessment of faults and seismic activity should be conducted to avoid drilling in hazard-prone areas (IEA, 2012).
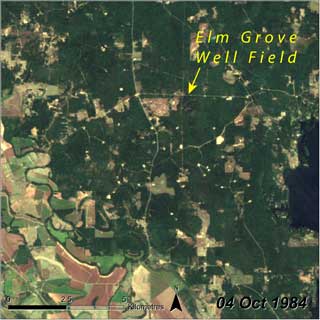
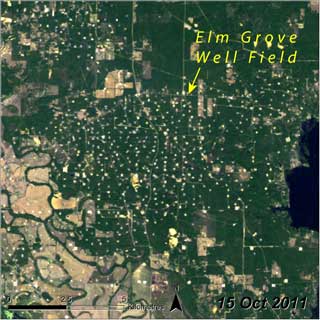
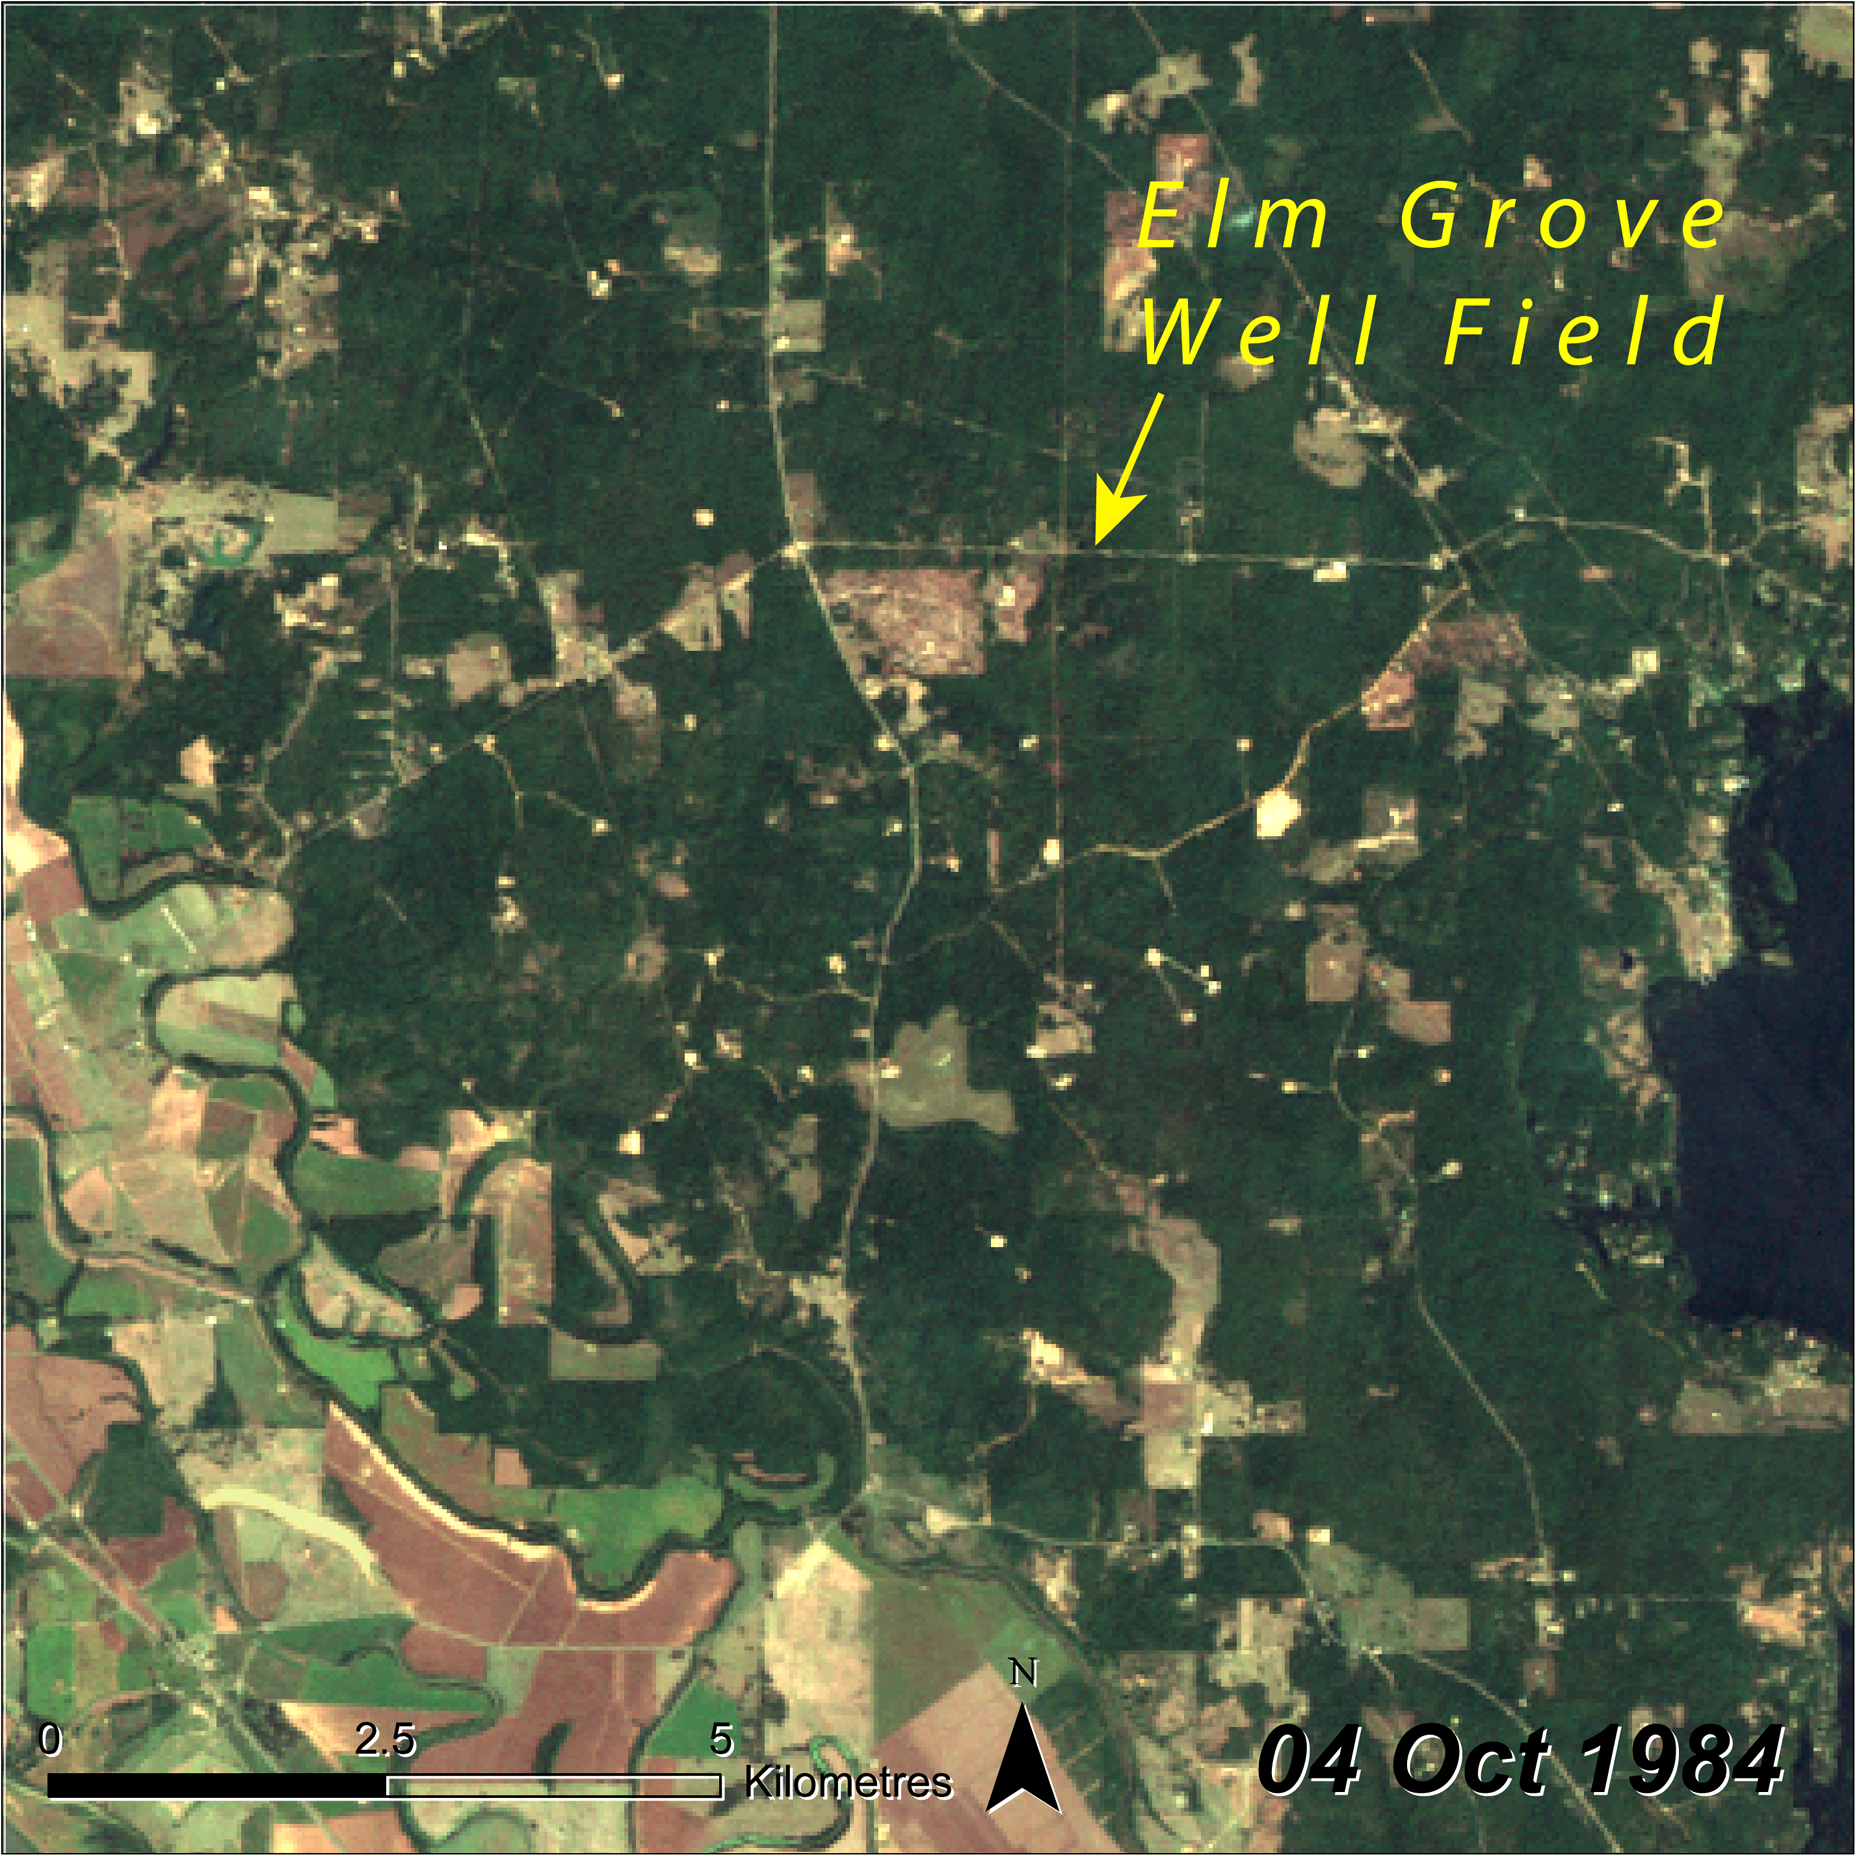
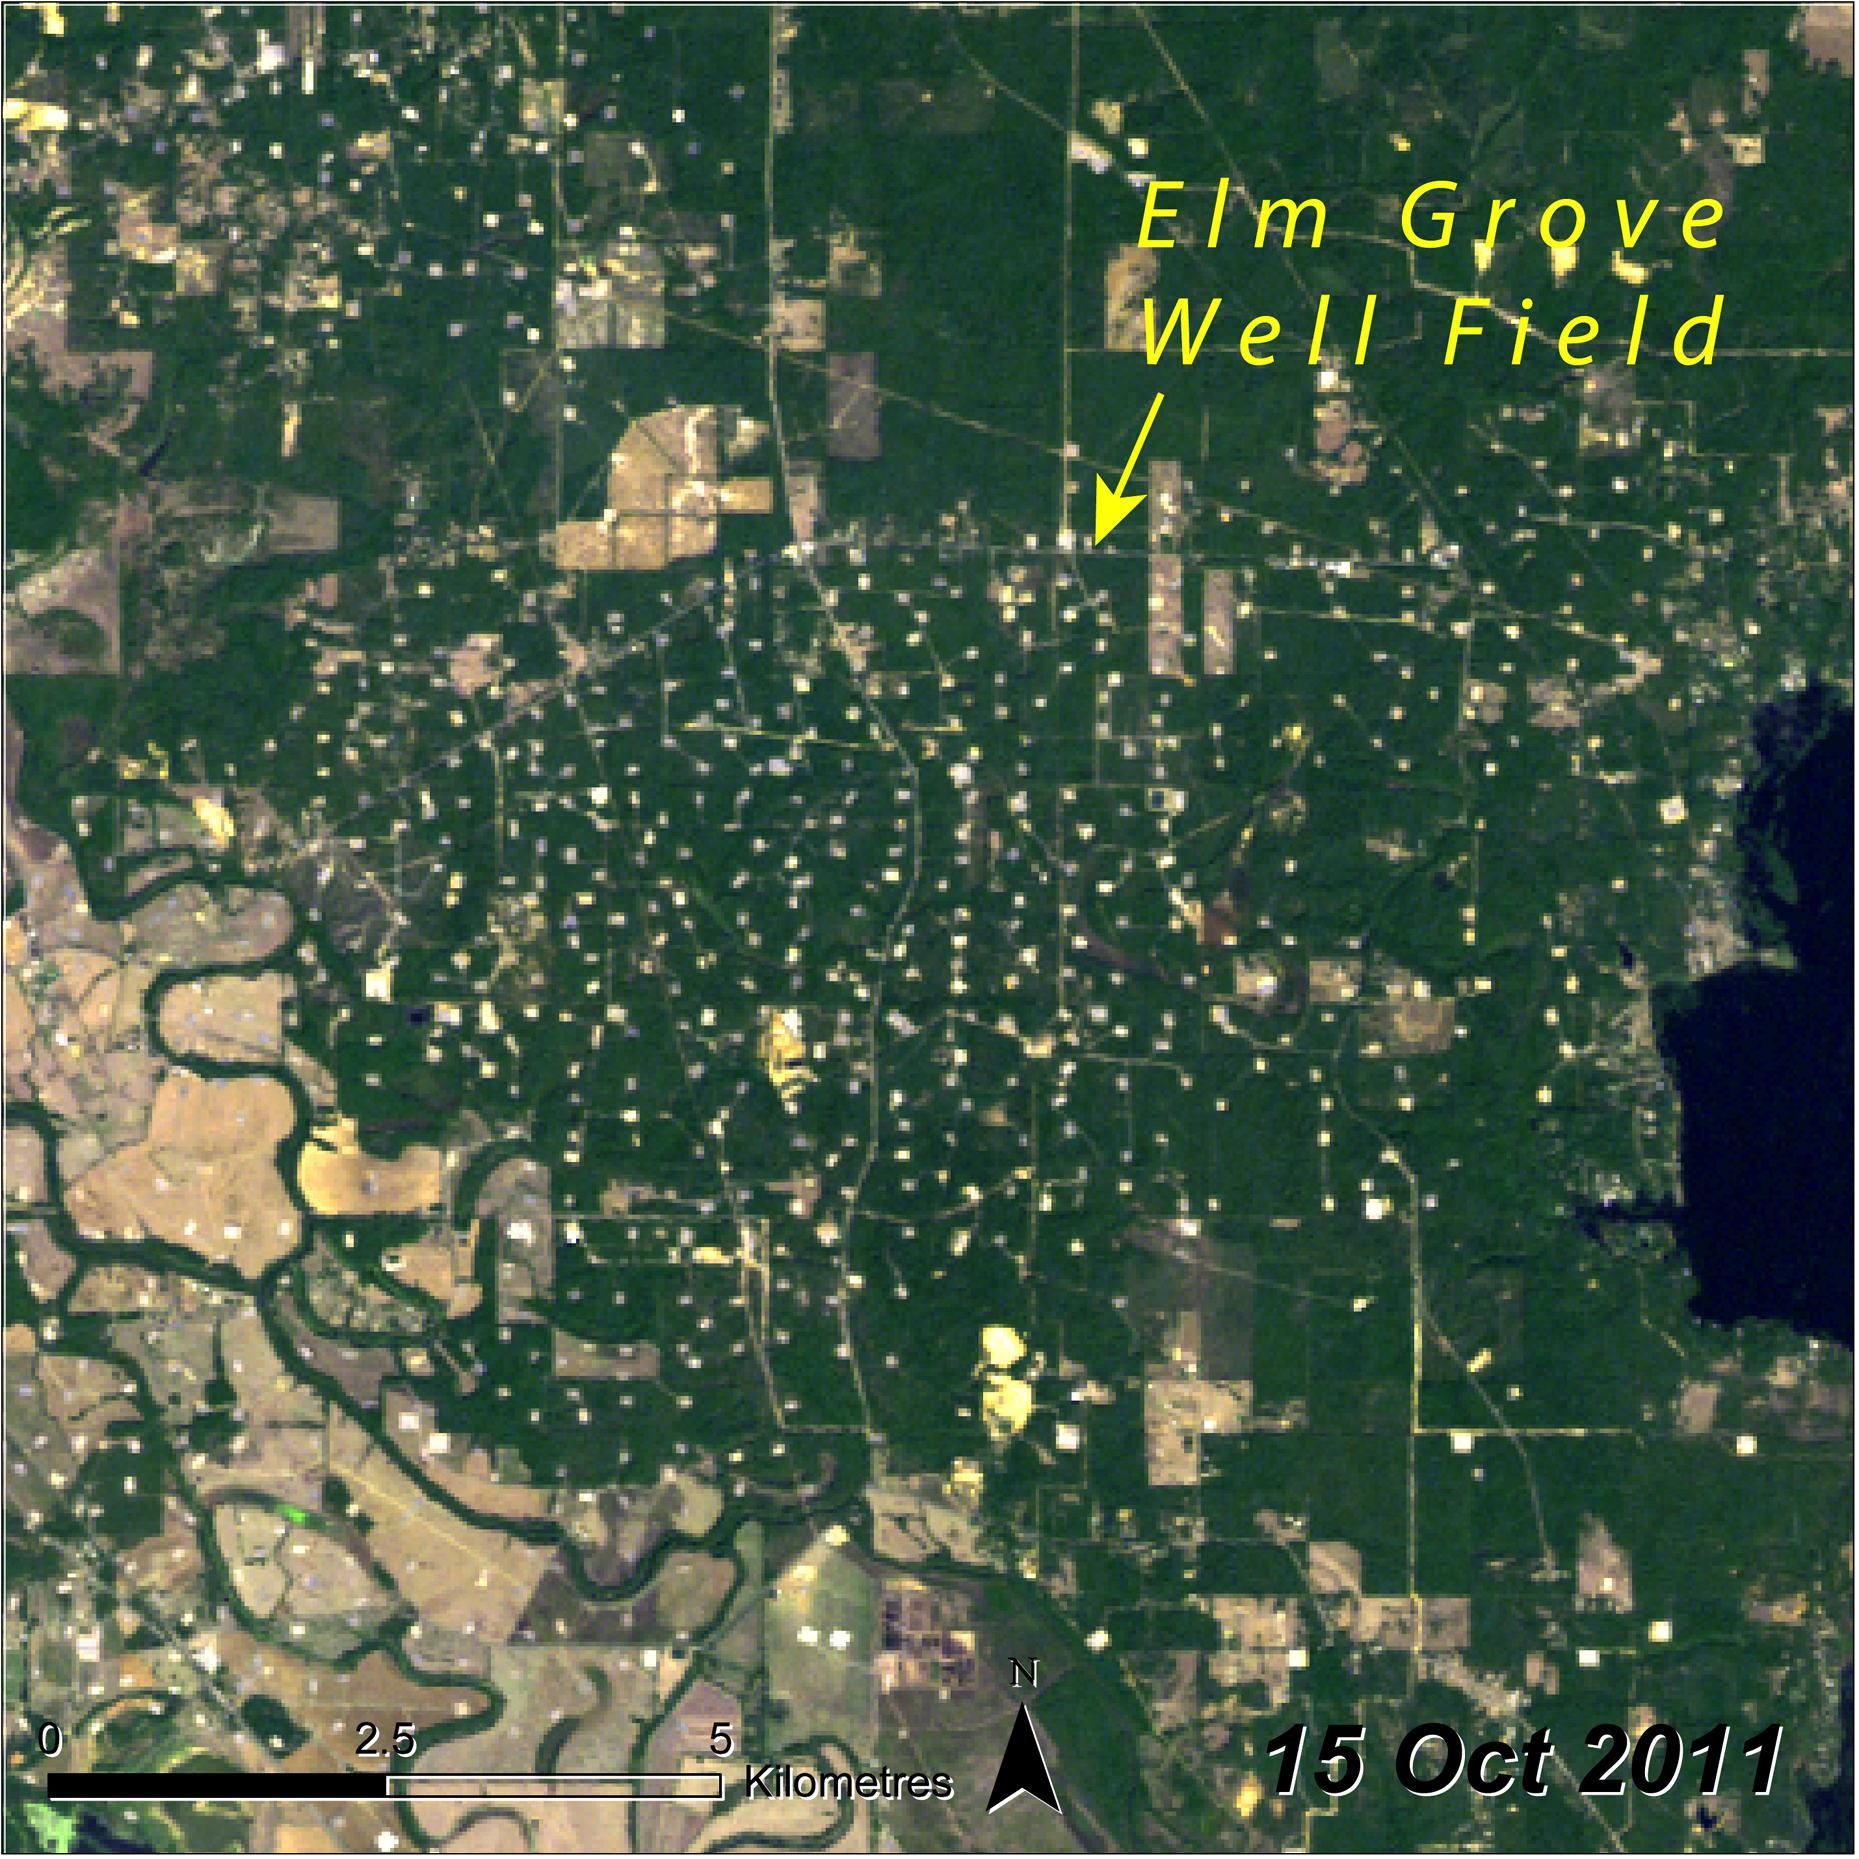
Figure 5: These two satellite images from 1984 and 2011 show the high density of wells where over 1000 UG
well pads (small, white dots) were cut into the Louisiana landscape (USA), most of them in recent years, as use of hydraulic fracturing technology became widespread.
The exploitation of UG has a significant footprint on the landscape (see Figure 5). As compared with CG, UG requires significantly more
wells due to the limited area exploited per well (1 km2) and shorter life span (five to 15 years), with most of the production occurring over
the first six months (IEA, 2012). Each well requires approximately one to two hectares (ha) of land plus road networks (Belvalkar and Oyewole, 2010).
Drilling also requires the clearing of land, which has a negative impact on landscapes and biodiversity, and can lead to significant soil erosion
and sediment disposition (Adams et al., 2011). Horizontal drilling allows multiple wells to be placed in one location and thus limits the
impact on the surface environment (NPS, 2008). In shallower settings (e.g. on coalbed methane), vertical drilling is economically more profitable
but has increased impact on land (IEA, 2012). The restoration of well sites after exploitation needs to consider soil salinity and acidity.
Often restoration fails due to toxicity problems (Cook and Johnson, 2002).
Water scarcity and competition
Fracking is an extremely water-intensive practice. A single horizontal shale gas well will use between 11 and 34 million litres of water,
roughly 360 1100 truckloads. The exact amount varies depending on the size of the area being exploited, the depth of the well and the
geological characteristics of the formation (Harper, 2008; Brownell, 2008).
Electricity produced using UG uses substantially more water than solar or wind depending on the area in which the unconventional
reserves are located. This could be a major limitation if drilling occurred in an area
in which water resources are scarce (Sovacool and Sovacool, 2009).
Tight gas requires 100 times more water than CG and shale gas between 2000 - 10000 times compared with conventional gas exploitation (IEA, 2012).
Although water can be recycled, excessive water usage can have broad and serious negative impacts (IEA, 2012) on biodiversity and local ecosystems,
while lowering the water table, resulting in reduced availability of water for use by local communities and agriculture. The depletion of aquifers
as a consequence of CBM production is well known; production of CBM also increases the amount of dissolved salts and other minerals in some areas (IEA, 2012).
The needs of water for exploitation and the depletion of aquifers has (and will) create conflicts in water usages. Notably, competition with
agricultural users is likely to be a serious issue (IEA, 2012).
Produced water
Underground water often needs to be pumped from coalbed methane wells. This is referred to as "produced water". Produced water needs to be properly
treated before it can be released, as it can contain high concentrations of sodium, calcium and magnesium. If spilled onto surrounding fields without
appropriate treatment, produced water can cause severe damage. Saline water can inhibit germination and plant growth while excessive sodium can
change the physical properties of soil and result in poor drainage, crusting and reduced crop yields (IEA, 2012).
Risk of water leakages
Leakage of fracturing fluids into the water table causing water contamination or explosions can occur if the cement columns around the well
casings have an imperfect seal. Several examples of leaks in the casing leading to explosions or contamination of the water table have occurred
in the USA (Myers, 2011 and Zoback et al., 2010). Discharge of improperly treated waste water could lead to seepage into ground water.
The leakage of hydrocarbons or chemicals from the UG producing zone into shallow aquifers is possible, however with low probability. This is an
issue that may occur in CBM production due to relatively shallow depths of exploitation, but is less likely with shale and tight gas extraction.
Evidence of water contamination by fracturing fluids and methane was found in Wyoming, where wells are shallower than average (EPA, 2011a).
In aquifers overlying the Marcellus and Utica shale formations of northeastern Pennsylvania and upstate New York, Osborn and others (2011) found
systematic evidence of methane contamination of drinking water associated with shale gas extraction. For the 316000 wells analysed in Alberta, 4.6% had
leaks (Watson and Bachu, 2007, in Nygaard, 2010). The main origin of groundwater contamination is as a result of accidental spills of fluids or
solids at the surface. A review of publications on well leakage worldwide concluded that, "cased wells are more prone to leakage than drilled and
abandoned wells, and injection wells are more prone to leakage than producing wells." (Nygaard, 2010). There is a risk that fracturing the rocks might
ease the migration of naturally occurring toxic substances present in the subsurface, such as mercury, lead or arsenic (EPA, 2011b; EU, 2011).
Spills or leaks can also occur during the transport, mixing and storage of the water and flowback. Spills from pits have been widely reported due to a
number of reasons, including improper lining of the pit or from storms. Between 2008 and 2010, Marcellus Shale gas drillers in Pennsylvania (USA) were
cited for 1435 violations, 952 of which were considered "likely" to be detrimental to the environment (Gilliland, 2010).
None of these hazards are new risks or exclusively tied to unconventional extraction and production methods. However, given that the number of UG wells
has increased, these problems are more likely to occur. Moreover, chemicals added to the fracturing fluid can add to the danger level of the leaks.

Flowback and fracking fluid storage in open air settings.
|
A proportion of the injected fluid returns to the surface through the well, in a process referred to as flowback. Flowback contains the fluids that were
initially injected into the well, as well as naturally occurring substances within the fractured rock formations, such as minerals, salt, weakly radioactive
material and potentially toxic substances such as arsenic, benzene, methane or mercury (Kargbo et al., 2010). Flowback must be collected, treated and properly
disposed off, as concentrations of contaminants can be very high. To reduce transport requirements, flowback can be treated on site and re-injected into the
well, but is often stocked on site, in tanks or in open evaporation pits (Manz, 2011). In the latter case, air pollution caused by the evaporation of
chemicals can be severe (Madsen and Schneider, 2011).
What can be done?
 | |
Drilling requires the clearing of land which alters the landscape.
Here, trees have been cleared to build a road to reach the drilling site.
|
Ultimately the best solution would be to lessen our dependency on fossil fuels. Given the uncertainty in terms of GHG emissions, public health,
environmental issues and depletion of water resources, the continued development of UG reserves is an option which brings with it great responsibility.
For governments that choose this path, there are recommendations which, if followed, would reduce the risk of environmental impacts, while resulting
in just a small increase in production costs.
The actions needed for reducing environmental costs can be divided in technical and policy types.
Technical considerations:
- Fracking should be avoided in areas of water scarcity, in close proximity to densely populated areas, and/or in areas where it can impact
on agricultural production. Sites deep below the water table are safer (IEA, 2012).
- Rigorous training and strict oversight can prevent (or contain) surface spills and leaks from wells and ensure that any waste fluids
and solids are disposed off properly (IEA, 2012).
- To minimize climate impacts, developers should be encouraged to implement a zero-venting and minimal flaring policy. This is technically
feasible by separating gas during the drilling process (IEA, 2012).
- CO2 can react with materials used to construct a well. For example, it is known to reduce cement's strength and increase its permeability.
CO2 can also corrode steel, and thus injection wells should be designed to minimize this risk (Nygaard, 2010).
Policy considerations:
Solutions to some of the issues that UG extraction presents are not only based on using better drilling techniques, but are also related to
improving environmental governance such as setting rules for environmental, climate and health protection. Such regulations could include:
- Mandating full disclosure of products used in the fracking process and banning substances known to be harmful;
- Implementing monitoring and enforcement procedures.
- Robust regulations and adherence to industry best practices should be followed, particularly in the areas of well design and cementing,
in order to completely isolate the well from other strata, and especially from freshwater aquifers.
- Governments should also ensure that companies secure enough funds for restoration of land and mitigate any potential impacts on land and
water, in order to avoid so-called "extract and run" practices (a company declares bankruptcy after large accidents or simply after the
end of UG extraction to save on restoration costs).
- Finally, if UG is used during a transition phase from carbon-based energy sources, governments should design a plan to achieve this
transition. Laws, taxes or other incentives would need to be in place to assure that a certain level of UG-related profits are re-invested
in research and development on alternative sources of energy, such as solar, wind, hydropower, geothermal, tidal, and on energy-saving policies.
Conclusions
Hydrologic fracking may result in unavoidable environmental impacts even if UG is extracted properly, and more so if done inadequately
(EU, 2011). Even if risk can be reduced theoretically (IEA, 2011), in practise many accidents from leaky or malfunctioning equipment as well as
from bad practises are regularly occurring. This may be due to high pressure to lower the costs or to improper staff training, or to undetected
leaks leading to contamination of the ground water (EU, 2011).
Existing laws and regulations of the mining activities often do not address specific aspects of hydraulic fracturing. For governments who
choose this path, UG will require dedicated regulations (EU, 2011).
The debate on UG exploitation cannot be disassociated from a "comeback" of fossil fuels. UG is and will be produced by the same actors.
Although only very recent, the history of UG exploitation already includes instances of water contamination, leakages to soil, wide-scale
land clearing and negative health impacts. Furthermore, increased extraction and use of UG is likely to be detrimental to efforts to curb
climate change. Given the increased demand for fossil energy, the UG may be used in addition to coal, rather than being a substitute. Even under
the optimistic assumption of the substitution of coal by UG, UG will likely have a limited reduction impact on 21st century global warming.
The claim that UG can reduce GHG emissions is conditional on whether UG, over its entire life-cycle, is demonstrated to have a much lower GWP
than coal (Howarth, 2011; Jiang, 2011; Hayhoe et al, 2002 ; Wigley, 2011; Hultman et al., 2011; Burnham et al.,2011; IEA, 2011; EU, 2011).
Given the ever-increasing demand for energy, UG use is likely to grow. With large gas reserves and the comparative advantage of using existing
infrastructures, equipments and networks from the oil and gas industry (drilling equipment, pipelines, thermal power stations, etc) UG will
remain a tempting power source for the industry and for some governments who want to decrease their foreign dependency on energy. However it
will face strong opposition given low public acceptance in certain places. As a non-renewable source of energy, UG remains a stop-gap measure
in the transition to a low carbon future. In order to develop energy plans that maximize benefits and minimize harm, other forms of energy
will also be needed (McKay, 2008).
Finally, injecting toxic chemicals in underground restricts later use of the contaminated layer (e.g. for geothermal purposes) and
long-term effects are not investigated (EU, 2011). New technologies and or energy supplies, such as biofuels or UG, are often greeted as a
panacea, but under further investigation are revealed to be less ideal than originally thought. Further research and appropriate,
transparent and well-enforced regulation are all critical to possible development of the unconventional gas industry.
Acknowledgement
Written by: Pascal Peduzzia and Ruth Hardinga.
Reviewed by: Ron Witta, Mark Radkab, Djaheezah Subrattyb, Zinta Zommersc, Lindsey M Harrimand.
Production and Outreach Team: Arshia Chanderd, Erick Litswac, Kim Giesed, Michelle Anthonyd, Reza Hussaind, Theuri Mwangic.
(aUNEP/GRID-Geneva, b UNEP/DTIE, c UNEP/DEWA Nairobi, d UNEP/GRID-Sioux Falls)
References
Adams, M., Ford, W., Schuler, T. and Thomas-Van Gundy, M. (2011). Effects of Natural Gas Development on Forest Ecosystems, Proceedings of the 17th Central Hardwood Forest Conference, pp 219-226.
Arthur, J., Bohm, B. and Layne, M (2008). Hydraulic Fracturing Considerations for Natural Gas Wells of the Marcellus Shale, Paper presented at The Ground Water Protection Council 2008 Annual Forum Cincinnati, Ohio September 21-24, 2008. http://www.dec.ny.gov/docs/materials_minerals_pdf/GWPCMarcellus.pdf (accessed on 25 Nov, 2012)
Belvalkar, R. and Oyewole, S. (2010). Development of Marcellus Shale in Pennsylvania, In the Proceedings of the 2010 SPE Annual Technical Conference and Exhibition (ATCE), Florence, Italy. September 20-22, 2010
Boyer, C., Kieschnick, K., Suarez-Rivera, R., Lewis, R.E., Waters, G. (2006) Producing gas from its source, Oilfield Review, 36-49. http://geoworld.geoservices.com/~/media/Files/resources/oilfield_review/ors06/aut06/producing_gas.pdf (accessed on 25 Nov, 2012)
Brownell, M. (2008). Gas well drilling and development: Marcellus shale. Susquehanna River Basin Commission. http://www.srbc.net/whatsnew/docs/Marcellusshale61208ppt.PDF (accessed on 25 Nov, 2012)
Burnham, A., Han, J., Clark, C., Wang, M., Dunn, J. and Palou-Rivera, I. (2011). Life-Cycle Greenhouse Gas Emissions of Shale Gas, Natural Gas, Coal, and Petroleum, Environ. Sci. Technol., 46 (2), 619627.
Colborn, T., Kwiatowski, C., Schultz, K. and Bachran, M. (2011). Natural Gas Operations from a Public Health Perspective Human and Ecological Risk Assessment: An International Journal, 17(5), 1039-1056
Cook, J. and Johnson, M. (2002). Ecological restoration of land with particular reference to mining metals and industrial minerals: A review of theory and practice, Environ. Rev., 10, 41-71.
EPA (2011b). Plan to study the Potential Impacts of Hydraulic Fracturing on Drinking Water Resources. http://water.epa.gov/type/groundwater/uic/class2/hydraulicfracturing/upload/FINAL-STUDY-PLAN-HF_Web_2.pdf (accessed on 25 Nov, 2012)
EPA (2011a). Investigation of Ground Water Contaminatoin near Pavillion, Wyoming. Http://www.epa.gov/region8/superfund/wy/pavillion/EPA_ReportOnPavillion_Dec-8-2011.pdf (accessed on 25 Nov, 2012)
EU (2011). Impacts of shale gas and shale oil extraction on the environment and on human health, Environment, Public health and food Safety, Policy Department economic and scientific policy, Directorate-General for Internal Policies, Brussels, European Parliament, pp. 91.
Gilliland, D. (2010). Marcellus Shale gas drillers committed 1435 violations in 2.5 years, report says, The Patriot-news, 2 August, 2010. http://www.pennlive.com/midstate/index.ssf/2010/08/marcellus_shale_gas_drillers_c.html (accessed on 25 Nov, 2012)
Harper, J. (2008). The Marcellus Shale- An Old "New" Gas Reservoir in Pennsylvania, Pennsylvania Geology, vol. 38, pp 2-12. http://www.dcnr.state.pa.us/topogeo/pub/pageolmag/pdfs/v38n1.pdf
Hayhoe, K., Kheshgi, H., Jain, A., Wuebbles ,D. (2002). Substitution of Natural Gas for Coal: Climatic Effects of Utility Sector Emissions, Climatic Change, 54(1-2), 107-139.
Holland, A. (2011). Examination of Possibly Induced Seismicity from Hydraulic Fracturing in the Eola Field, Garvin County, Oklahoma, Oklahama Geological Survey Open-File Report OF1-2011.
Howarth, R., Ingraffea, A. and Engelder, T. (2011a). Natural gas: Should fracking stop? Nature, 477, 271-275.
Howarth, R., Santoro, R. and Ingraffea, A. (2011b). Methane and the greenhouse-gas footprint of natural gas from shale formations, Climatic Change, 106(4), 679-690.
Hultman, N., Rebois, D., Scholten, M. and Ramig, C. (2011). The greenhouse impact of unconventional gas for electricity generation, Environ. Res. Lett., 6 044008, 1-9.
IEA (2010). World Energy Outlook, International Energy Agency, 2010.
IEA (2011). World Energy Outlook, International Energy Agency, 2011.
IEA (2012). Golden rules of a golden age of gas, World Energy Outlook, Special Report on Unconventional Gas, International Energy Agency, pp. 143, Paris, France, 2012.
IPCC (2007). Solomon S, Qin D, Manning M, Chen Z, Marquis M, Averyt KB, Tignor M, and Miller HL(eds.), Contribution of Working Group I to the Fourth Assessment Report of the Intergovernmental Panel on Climate Change, 2007, Cambridge University Press, Cambridge, United Kingdom and New York, NY, USA.
Jiang, M., Griffin, W., Hendrickson, C., Jaramillo, P., VanBriesen, J. and Venkatesh, A. (2011). Life cycle greenhouse gas emissions of Marcellus shale gas, Environ. Res. Lett. 6 034014, 1-9.
Kargbo, D., Wilhelm, R. and Campbell, D. (2010). Natural Gas Plays in the Marcellus Shale: Challenges and Potential Opportunities, Environ Sci. Technol., 44, 5679-5684.
Madsen, T., Schneider, J. and Staff, E. (2011). Vulnerable Pennsylvanians at Risk. How Shale Gas Extraction Puts Vulnerable Pennsylvanians at Risk. PennEnvironment Research and Policy Center. http://www.pennenvironment.org/sites/environment/files/reports/In%20the%20Shadow%20of%20the%20Marcellus%20Boom.pdf (accessed on 25 Nov, 2012)
Manz, D. (2011). Treatment of Frac Flow-Back Water Oasis Filter International Ltd. http://www.oasisfilter.com/FracJan2011.pdf (accessed on 25 Nov, 2012)
Milosevic, Z. and Markovic, S. (2012). The changing geopolitics of energy, J. Geogr. Inst. Cvijic, 62(1), 125-134.
McCubbin, D. and Sovacool, B. (2011). The hidden Factors That Make Wind Energy Cheaper than Natural Gas in the United States, The Electricity Journal, 24 (9), 84-95.
MacKay, D. (2008). Sustainable EnergyWithout the Hot Air. Cambridge, United Kingdom: UIT Cambridge Ltd.
Myers, R. (2011). The Environmental Dangers of Hydro-Fracturing the Marcellus Shale Lock Haven University Environmental Studies site. http://www.lhup.edu/rmyers3/marcellus.htm (accessed on 25 Nov, 2012)
NPS (2008). Potential Development of the Natural Gas Resources in the Marcellus Shale, National Park Service, USA. http://www.nps.gov/frhi/parkmgmt/upload/GRD-M-Shale_12-11-2008_high_res.pdf (accessed on 25 Nov, 2012)
NYS-WRI (2011). New York State Water Resources Institute Waste Management of Cuttings, Drilling Fluids, Hydrofrack Water and Produced Water http://wri.eas.cornell.edu/gas_wells_waste.html (accessed on 25 Nov, 2012)
Nygaard, R. (2010). Well design and well integrity, Energy and Environmental Systems Group, Institute for sustainable energy, environment and economy, University of Calgary, pp. 39, Calgary, Canada. http://www.ucalgary.ca/wasp/Well%20Integrity%20Analysis.pdf (accessed on 25 Nov, 2012)
Osborn, S., Vengosh, A., Warner, N. and Jackson, R. (2011). Methane contamination of drinking water accompanying gas-well drilling and hydraulic fracturing. Proc Natl Acad Sci USA, 108(20), 81728176.
Ridley, M. (2011).The Shale Gas Shock, Washington DC Global Warming Policy Foundation, Report 2, 2011.
Rahm, D. (2011). Regulating hydraulic fracturing in shale gas plays: The case of Texas, Energy Policy, 39, 2974-2981.
Royal Society (2012). Shale gas extraction in the UK: a review of hydraulic fracturing, Royal Academy of Engineering, The Royal Society, pp. 76, London, UK, 2012.
Santoro, R., Howarth, R. and Ingraffea, R. (2011). Indirect Emissions of Carbon Dioxide from Marcellus Shale Gas Development. A Technical Report from the Agriculture, Energy, & Environment Program at Cornell University. June 30, 2011
Sminchak , J., Gupta, N., Byrer, C. and Bergnab, P. (2011). Issues related to seismic activity induced by the injection of CO2 in deep saline aquifers, National Energy Technology Laboratory, Battelle Memorial Institute, Columbus, Ohio, USA. http://netl.doe.gov/publications/proceedings/01/carbon_seq/p37.pdf (accessed on 25 Nov, 2012)
Sovacool, B. and Sovacool, K. (2009). Identifying future electricity-water treadeoffs in the United States, Energy Policy, 37, 2763 - 2773.
UNEP (2010). The emissions gap report, are the Copenhagen accord pledges sufficient to limit global warming to 2° C or 1.5 °C? a preliminary assessment, United Nations Environment Programme, pp 55.
UNEP (2011a). Athabasca Oil Sands, Require Massive Investments and Energy and Produce Massive Amounts of Oil and CO2 Alberta (Canada), Global Environment Alert Service, 54, 1-5, United Nations Environment Programme, January 2011.
UNEP (2011b). Oil palm plantations: threats and opportunities for tropical ecosystems, Global Environment Alert Service, 73, 1-10, United Nations Environment Programme, December 2011.
UNEP (2012). The end to cheap oil: a threat to food security and an incentive to reduce fossil fuels in agriculture, Global Environment Alert Service, 81, 1-11, United Nations Environment Programme, April 2012.
Wang, J., Ryan, D. and Anthony, E. (2011). Reducing the greenhouse gas footprint of shale gas, Energy Policy, 39 (12), 8196-8199.
Wigley, T. (2011). Coal to gas: the influence of methane leakage, Climatic change, 108, 601-608.
Wood, R., Gilbert, P., Sharmina, M., Anderson, K., Fottitt, A., Glynn, S., Nicholls, F. (2011). Shale gas: a provisional assessment of climate change and environmental impacts. Tyndall Center, University of Manchester, Manchester, England.
Zoback, M., Kitasei, S. and Copithorne, B. (2010). Addressing the Environmental Risks from Shale Gas Development Briefing Paper 1 Worldwatch Institute Natural Gas and Sustainable Energy Initiative.
If you no longer wish to receive this bulletin you can unsubscribe anytime.
Information is regularly scanned, screened, filtered, carefully edited, and published for educational purposes. UNEP does not accept any liability
or responsibility for the accuracy, completeness, or any other quality of information and data published or linked to the site. Please read our
privacy policy and
disclaimer for further information.
|


