|
Having trouble reading this email?
View it on your browser or download the PDF.

IN THIS ISSUE
 |
One Small Planet, Seven Billion People by Year's End and 10.1 Billion by Century's End
Even though the global growth rate peaked more than 40 years ago, it is estimated that there will be another
billion added over the next 15 years and yet another billion before mid-century.
|
Thematic Focus: Environmental governance, Resource efficiency
One Small Planet, Seven Billion People by Year's End and 10.1 Billion by Century's End
Why is this issue important?
The two most widely cited estimates of global population project that Earth will be home to seven billion people sometime in late 2011
or early 2012 (US Census Bureau 2011, UNPD 2011a). The most recent billion was added in about 13 years; it took 12 years for the billion
before that; 13 years for the billion before that. Even though the global growth rate peaked more than 40 years ago, it is estimated that
there will be another billion added over the next 15 years and yet another billion before mid-century (UNPD 2011a). By the end of the
century it is estimated that there will be 10.1 billion people sharing our already crowded planet! (UNPD 2011a).
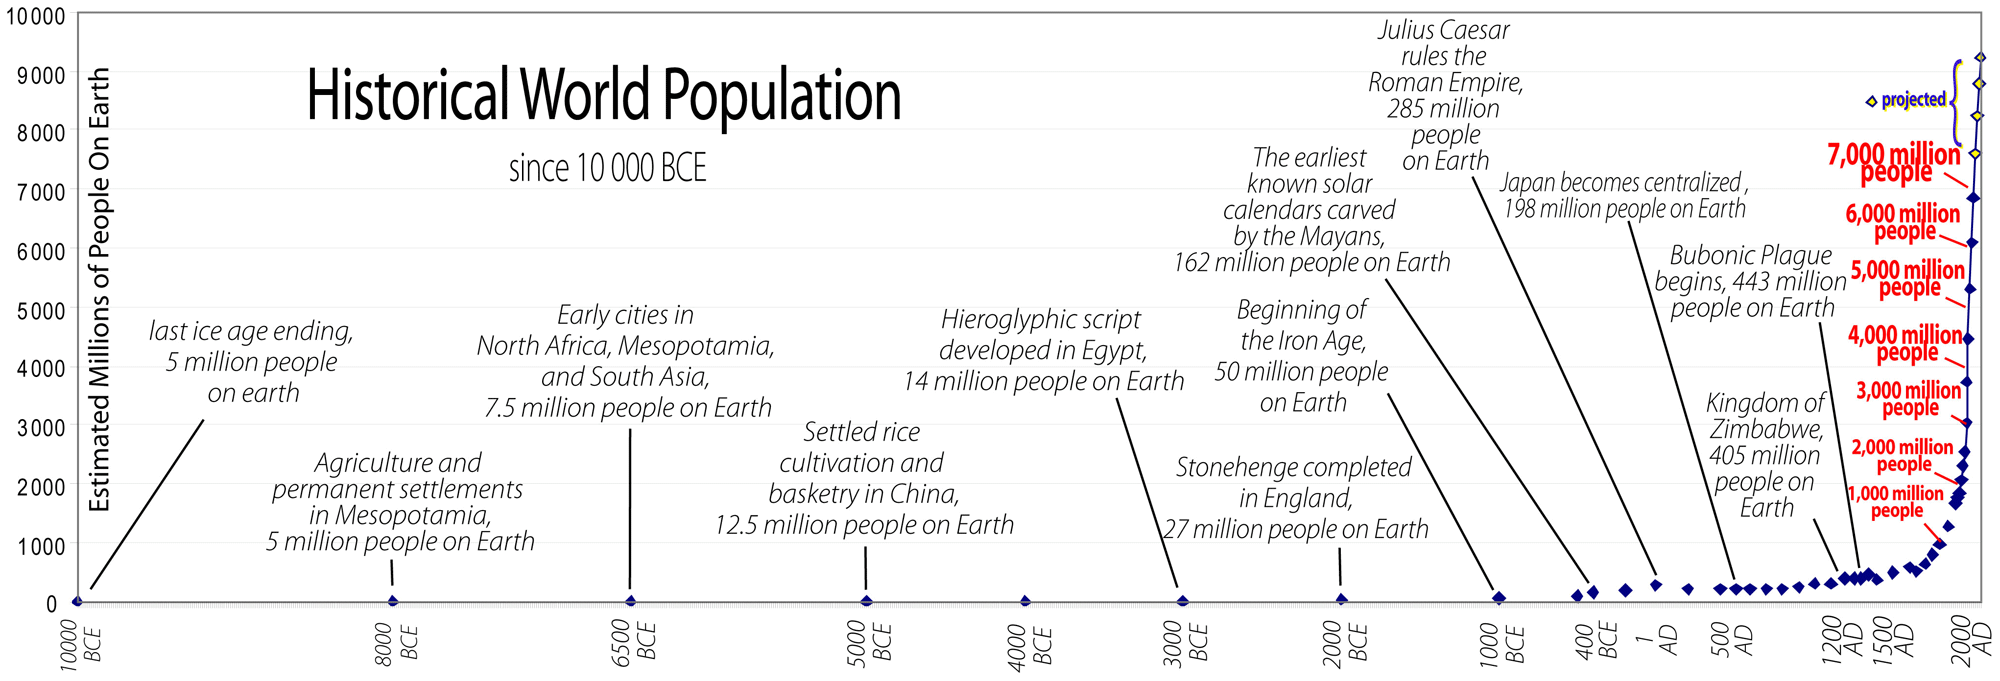
While modern humans are generally believed to have been around for over 100 000 years, it is only in the past 10 000 years that
total global population is believed to have ever exceeded a few million people—roughly the population of Madrid, Spain or Nairobi,
Kenya (Kremer 1993). After the end of the Last Glacial Maximum (~10,000 BCE), population growth started to accelerate, doubling every
600 to 1000 years between 3000 BCE and 1000 AD. By 1800, it was growing fast enough to double in just one hundred years. Between 1959
and 2000 the Earth's population doubled in just 40 years! By one estimate, the number of new mouths to feed each year peaked in 1989
at around 87 million (roughly the equivalent of Ethiopia's current population). In 2010, the planet was still adding 1 million people
every 4.8 days (US Census Bureau 2011).

Figure 1: World population began accelerating about 10 000 to 12 000 years ago and has “exploded” in the past 1 000 years.
Source: UNEP-GRID Sioux Falls, population data – US Census Bureau 2011.
Full Size Image
Will it ever slow down?
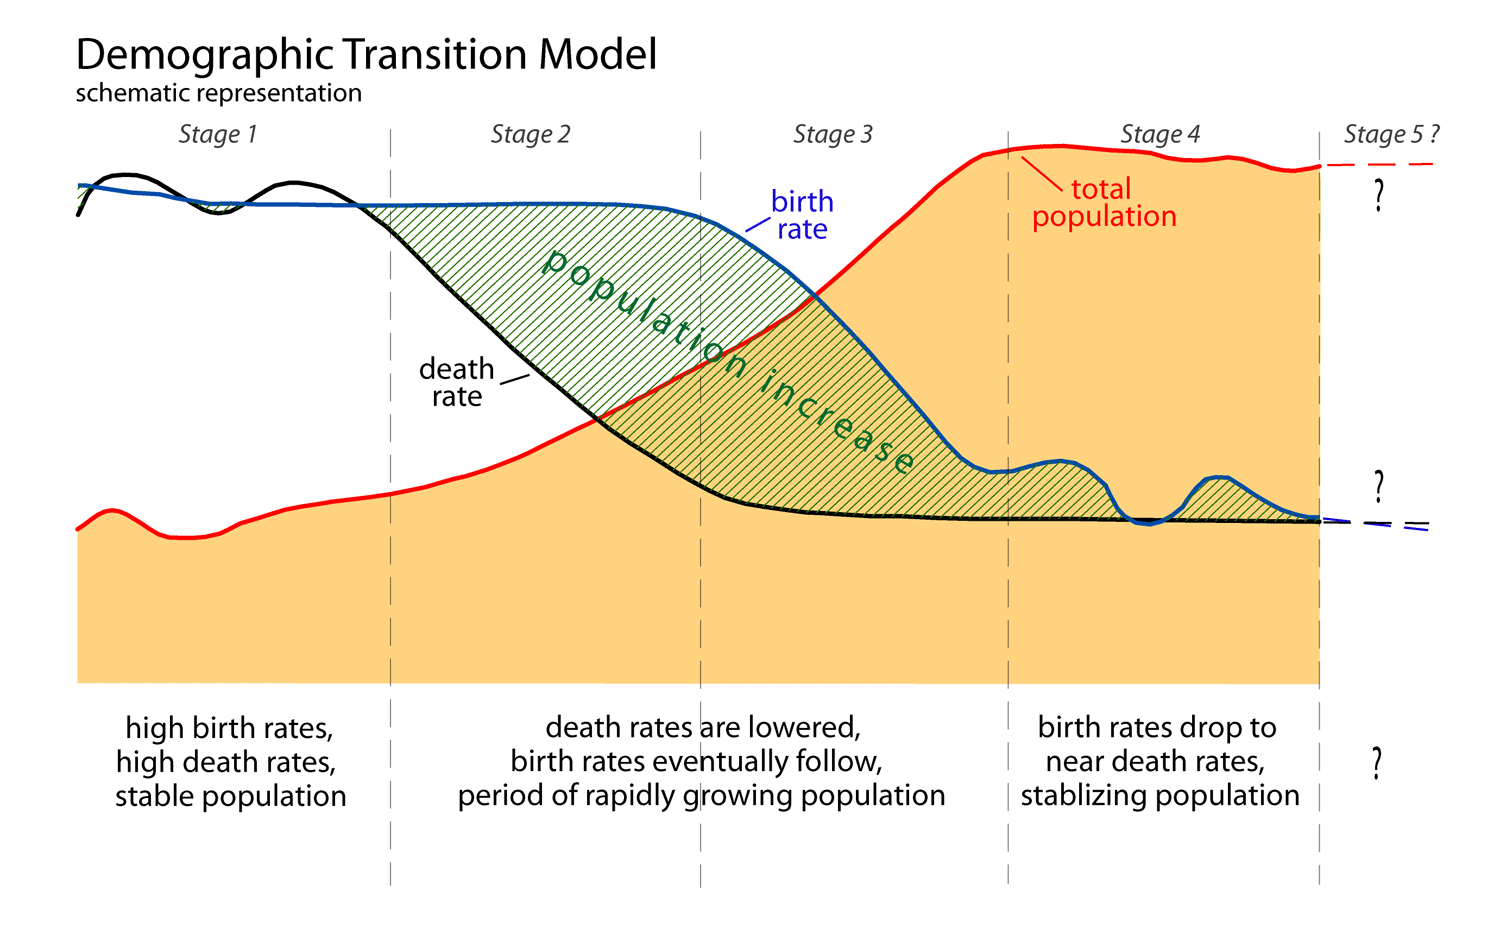
Peak global population growth rates of 2.1 per cent per year occurred in the 1960s and early 1970s (U.S Census Bureau 2011).
The subsequent slowing in global average population growth was the outcome of a dramatic drop in birth rates among the world's most
developed countries; many dropping to replacement level or even below (Bongaarts 2009). It is very widely accepted that this
phenomenon, part of something demographers call the demographic transition, reliably occurs in countries as they become developed
(DeLong and others 2010, Myrskyla and others 2009). This assumption is incorporated into estimates that project world population
leveling off at around 9.3 billion by the middle of this century (DeLong and others 2010, Bongaarts 2009). In general, projections
of future population also assume that the economic and social development that is an important dimension of demographic
transition can and will occur in many of the world's poorer countries (Delong and others 2010, Bongaarts 2009). Finally,
it is has been taken for granted that the lower birth rates characteristic of developed countries are more or less
"inevitable and irreversible" (Delong and others 2010).
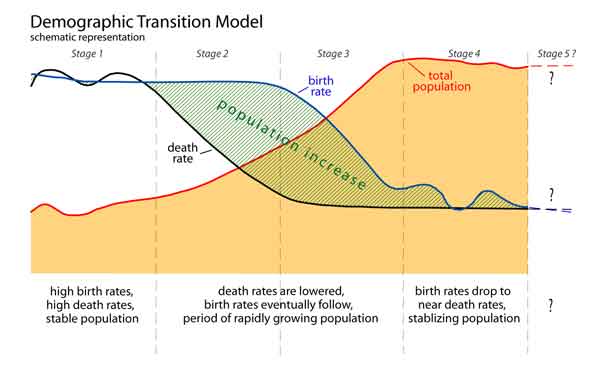
Figure 2: Demographic transition has occurred in parallel with social and economic development in the world's
most developed countries. Most population projections assume it will occur in many currently developing nations.
Source: UNEP-GRID Sioux Falls – generalized from multiple sources.
Full Size Image
Several researchers studying population dynamics, however, have begun to question these assumptions (Delong and others 2010, Myrskyla and
others 2009, Murphy and Hall 2011, Valentine 2010, Brown and others 2011, Luci and Thévenon 2010, Tuljapurkar 2009). One central
problem is that as the world's supply of cheap oil declines, increasing energy costs will hinder economic and social development,
which are presumed to be important drivers of demographic transition (Delong and others 2010, Murphy and Hall 2011, Hall and Day
2009, Brown and others 2011). Researchers warn that large amounts of cheap energy are needed to drive development (Nel and van Zyl
2010, Brown and others 2011, Hall and others 2001, DeLong and others 2010). The historical reality of the relationship between
per capita energy consumption and per capita GDP is illustrated in the graph below (Figure 3). As we reach (or have reached) "peak oil"
(Campbell and Laherrère 1998), there is good reason to doubt the sustainability of the current trend of rising global per capita GDP,
barring the emergence of a cheap and abundant alternative energy source (Delong and others 2010, Murphy and Hall 2010). While many
economists assume that energy scarcity will drive innovation and lead to replacement energy sources, there are many people, including
economists and ecologists, who believe that economic-growth models "must incorporate knowledge from the natural sciences" (Norgard 1992),
but that they fail to do so. In short, their contention is that if predictions from these economic models are to be taken as explicit
and not simply theoretical (with an "all other things being equal" caveat) then the inputs to these models must include explicitly
defined factors of future growth-potential, such as energy cost (Nel and van Zyl 2010, Valentine 2010, Brown 2011, Hall and
others 2001, Hall and Day 2010).
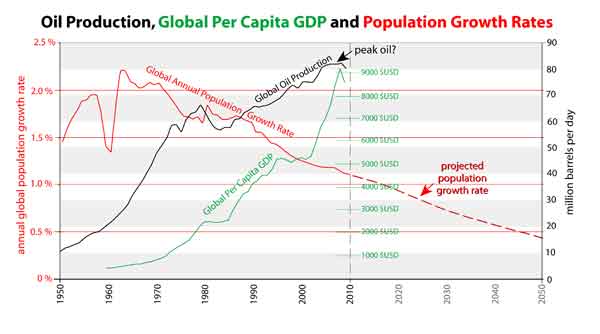
Figure 3: Global GDP has risen with global oil production. The global economic development reflected in per
capita GDP is linked to lower birth rates and population growth by the demographic transition concept. Source: UNEP-GRID Sioux Falls,
Data: EPI 2010, USDA 2010, World Bank 2011b
Full Size Image
A second major assumption for population to stabilize by mid-century is that low population growth rates in developed countries will
remain low. However, within some developed countries in which the demographic transition generally took place decades ago, there has
been an increase in population growth rates related to additional gains in affluence (Myrskyla and others 2009, Tuljapurkar 2009,
Luci and Thévenon 2010). While this dynamic seems only to apply in the most economically advanced countries, it is not currently part
of most models of future population growth and thus may undermine some of those models' projections (DeLong and others 2010, U.S.
Census Bureau 2010).
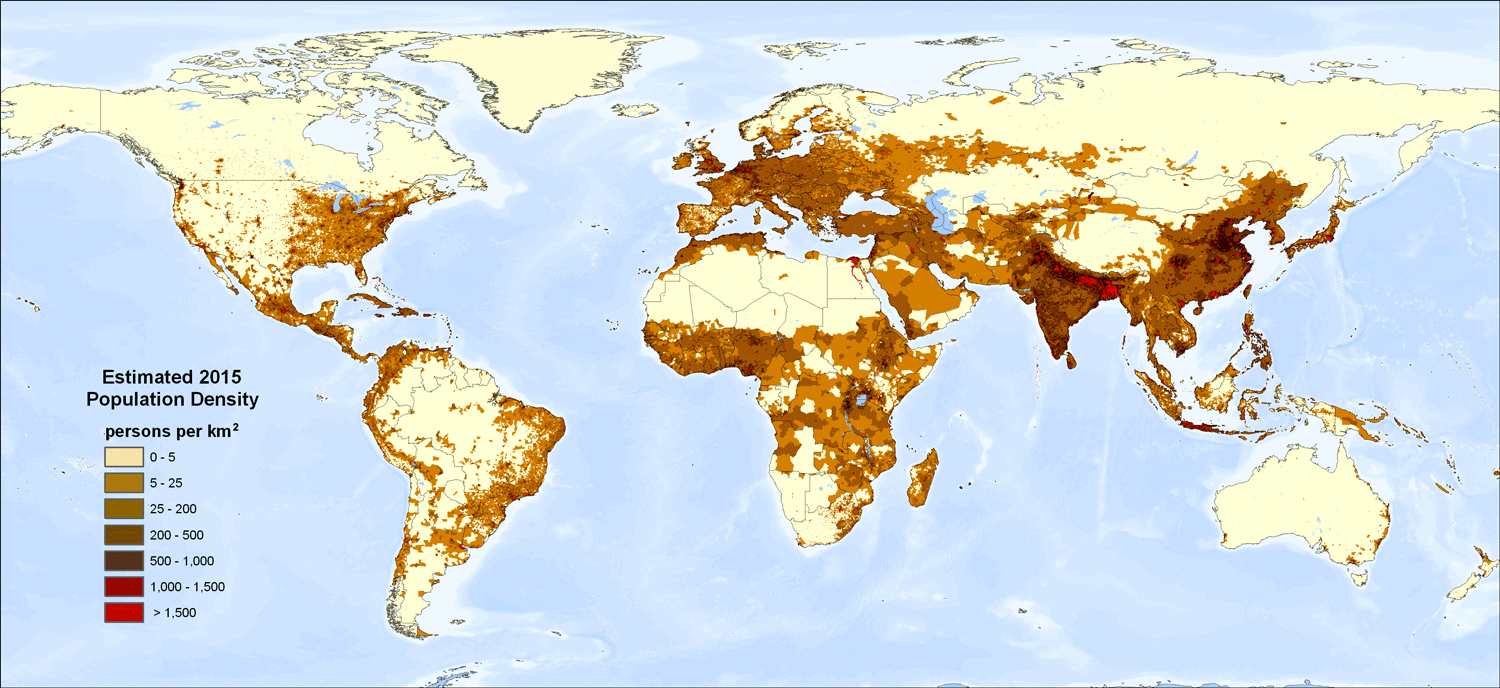
Our Already Crowded World—Some places more than others

Figure 4: Global population density is concentrated most heavily in Southeast Asia. Source: UNEP-GRID Sioux Falls, population data SEDAC 2010
Full Size Image
If population growth were to stabilize after mid-century, most experts think the unprecedented pressure of 9.3 Billion people
on the environment is unsustainable, without some dramatic changes in our consumption patterns (Valentine 2010, Hall and Day
2010, UN 2002). Paradoxically, under generally held assumptions of the demographic transition model, increasing numbers of consumers
in developing countries would consume at rates similar to those currently seen in the developed world. Thus, the rate of growth in
the number of consumers would decline, but might be more than offset by increased per capita consumption.
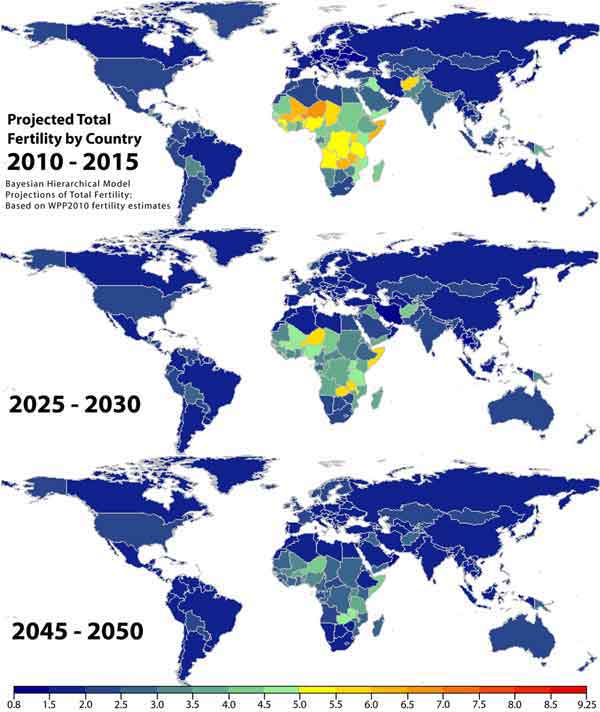
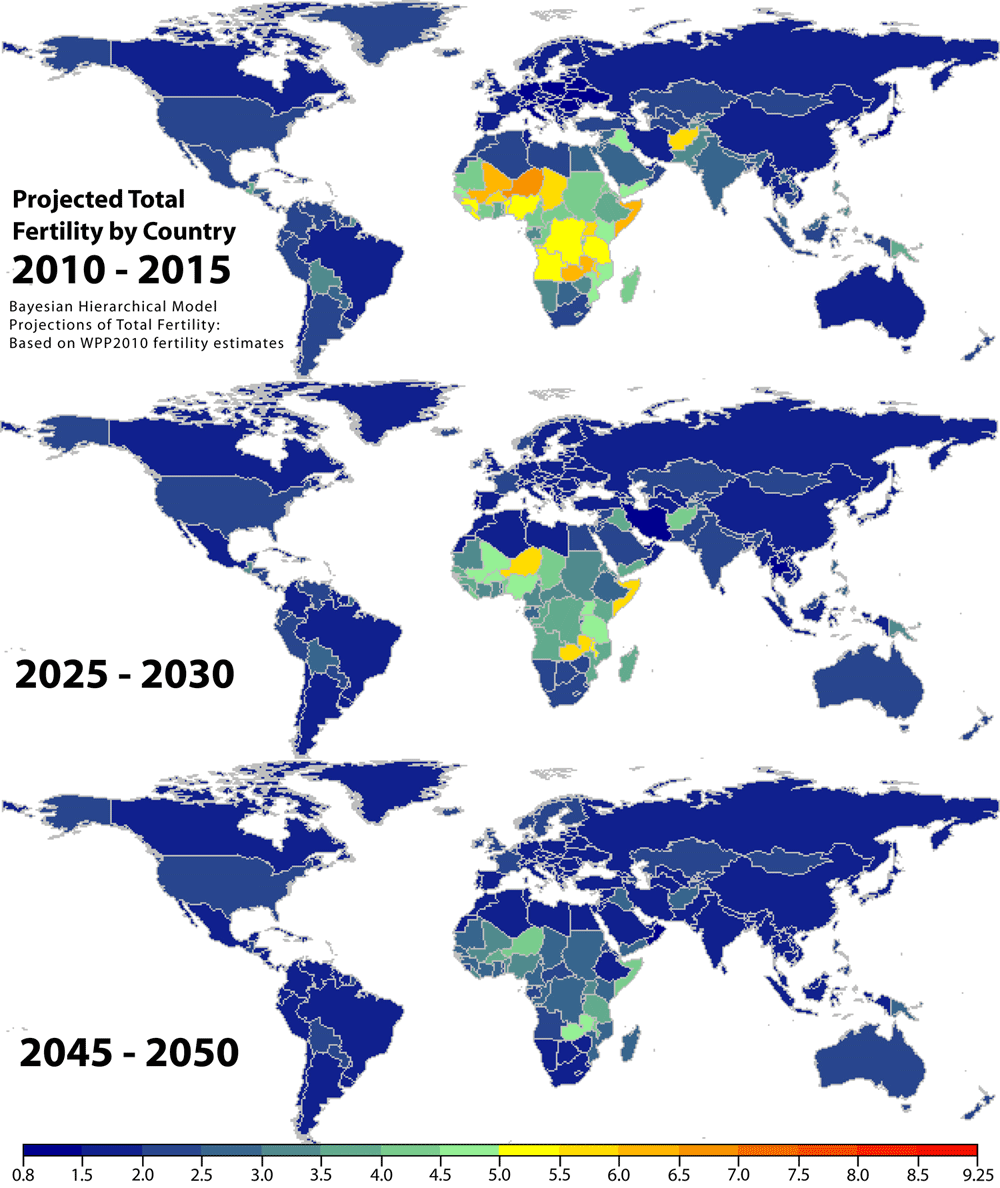
Figure 5: These maps of total fertility by country show birth rates, already low in much of the world,
will remain high in Africa and parts of Asia through mid century. Source: UNPD 2011b
Full Size Image
Rates of growth and existing population densities vary dramatically around the globe. Asia, especially south and southeastern Asia,
is home to the world's densest populations (Figure 4). China and India alone have 37 per cent of the world's current population
(UNPD 2011a). The fastest growing populations however, are mostly in Africa and West Asia (Figure 5).
Over half of the world's population already lives in urban agglomerations and this is where much of the coming population growth
will be seen (FAO 2005). The environmental impact of these dense urban footprints extends well beyond their physical limits, in
the form of agriculture, mining, water and energy extraction, transportation, fishing, polluting emissions, including CO2, timber
extraction, energy generation (hydropower, solar and wind facilities), and many other impacts on the natural ecosystem that take
place in the hinterland. In addition, remaining rural populations are crowding onto less and less available farmland and have
fewer and fewer natural environments from which to derive a living.
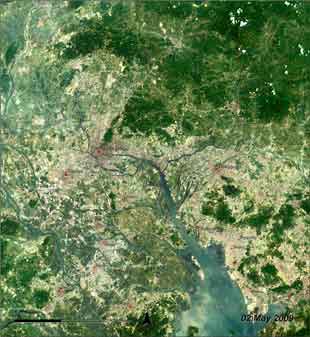
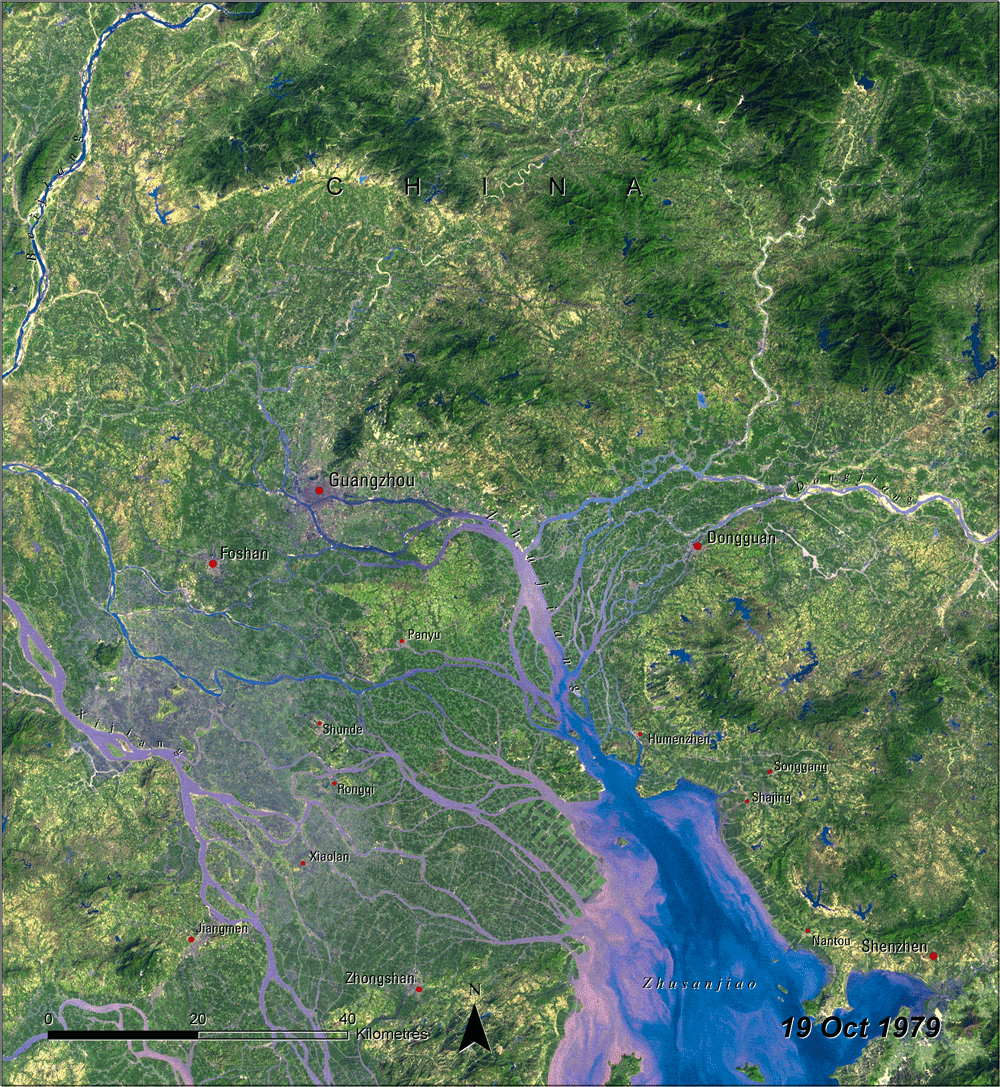
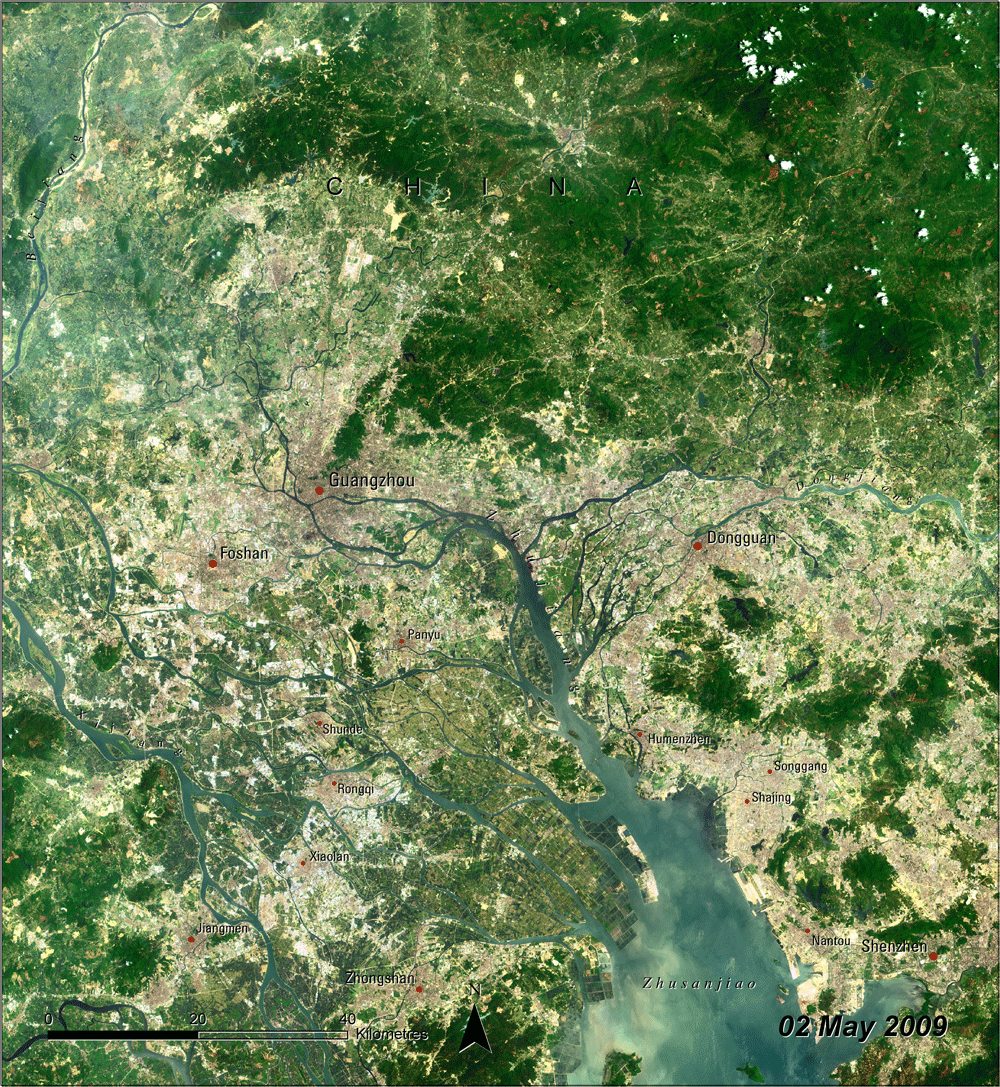
Pearl River Delta, southeastern China
Figure 6: The Pearl River Delta in 1979 had roughly 14 million people; by 2009 population had tripled to 44 million.
It is projected that by 2020, over 70 per cent of China's people will live in its cities (UN 2009). China's rate of rural-to-urban
transformation has been largely driven by market reforms put in place in the 1970s and the consequent development of industrial
centers such as those in the Pearl River Delta in southeastern China. The area has been an important and productive agricultural
area for China but it is losing farmland to some of the fastest urban growth in the world (Seto and Kaufmann 2003). Several urban
centers in the greater delta area have experienced dramatic accelerated growth through the 1990s (Sun and others 2010, SEDAC 2010)
putting intense pressure on the delta environment (Fragkias and Seto 2009) as the metro areas of Guangzhou, Dongguan, Foshan and
Shenzhen have all grown into cities of over five million people each (SEDAC 2010). Population within the area in the images above tripled in
just 20 years, from 14 million in 1990 to 44 million in 2010 (SEDAC 2010). As a result, large areas of productive farmland have been lost
and fragmented displacing food production to areas with poorer quality cropland and lower productivity (Yan and others 2009). Urban
and related land uses are displacing agricultural systems that have adapted to conditions on the delta and have been used in the area
for over 1000 years (Lo 1996, Weng 2007). The rate and scale of change has also created other serious environmental concerns,
including deforestation; soil erosion; and water pollution from industrial waste, domestic sewage, agricultural chemicals and
petroleum (Weng 2007).
Rwanda and Bangladesh
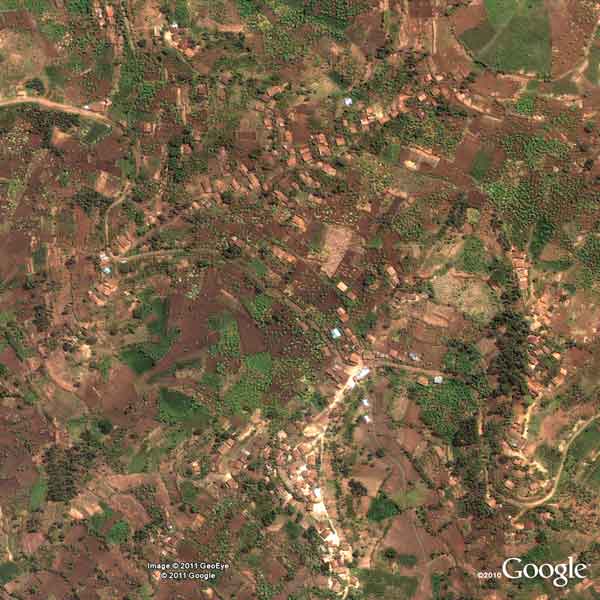
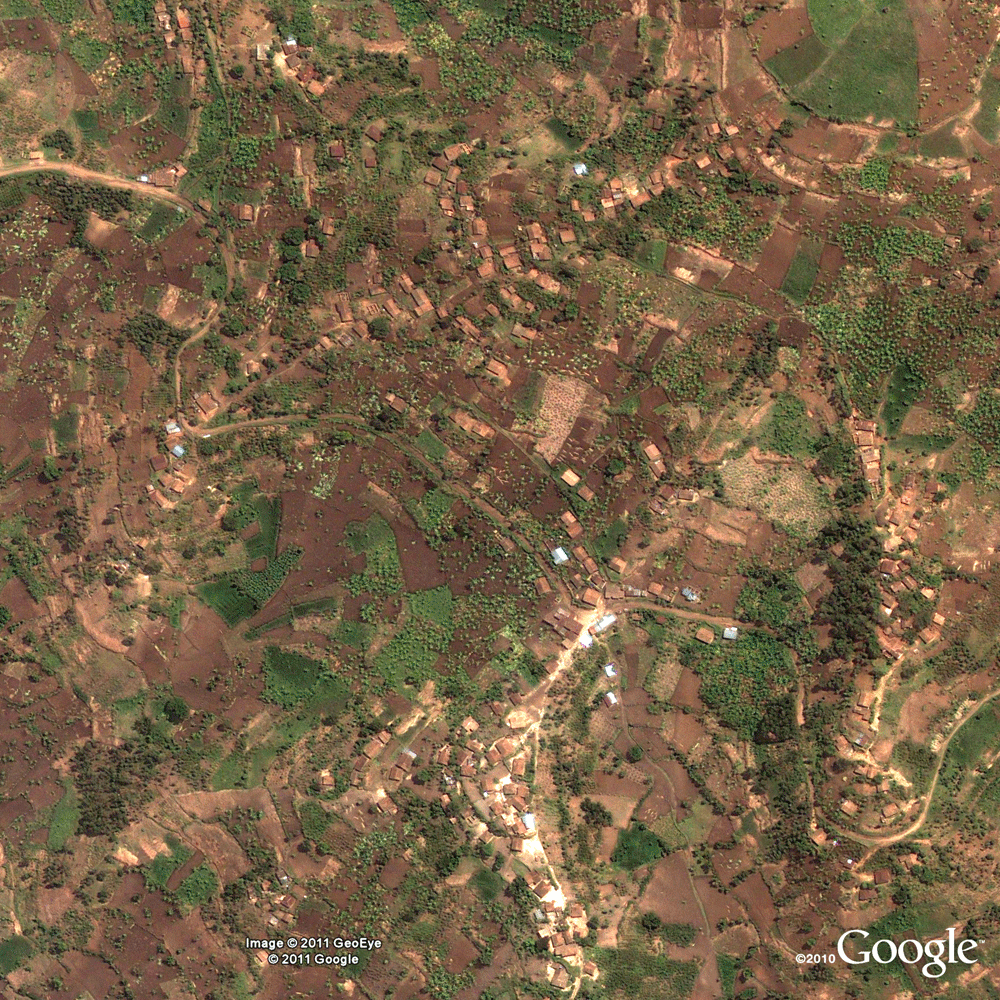
Figure 7: Rwanda has the densest rural population in continental Africa and the country’s growth rate
remains at 2.8 per cent per year. Source: Google Earth ©2011, ©GeoEye 2011.
Full Size Image
At the other end of the development spectrum, Bangladesh and Rwanda have two of the highest rural population densities among the
world's countries. They also both have a very high percentage of their land area under cultivation, and small average farm sizes;
mostly subsistence-oriented agriculture which makes up a very large proportion of their economies. Bangladesh's annual population
growth rate was 1.4 per cent as of 2009, not far above the global average of 1.2 per cent. Rwanda's annual population growth rate
was twice as high, at 2.8 per cent per year (World Bank 2011a). Literacy, which is fairly widely accepted as a driver of lower birth
rates, was higher in Rwanda at 65 per cent while it was only 54 per cent in Bangladesh. However, the most recent surveys show that in
Bangladesh, 55.8 per cent of couples use family planning methods compared to only 36.4 per cent in Rwanda (UNPD 2011a). Rwanda's
rate of family planning use, however, was double what it was just a few years earlier (UNPD 2011a).
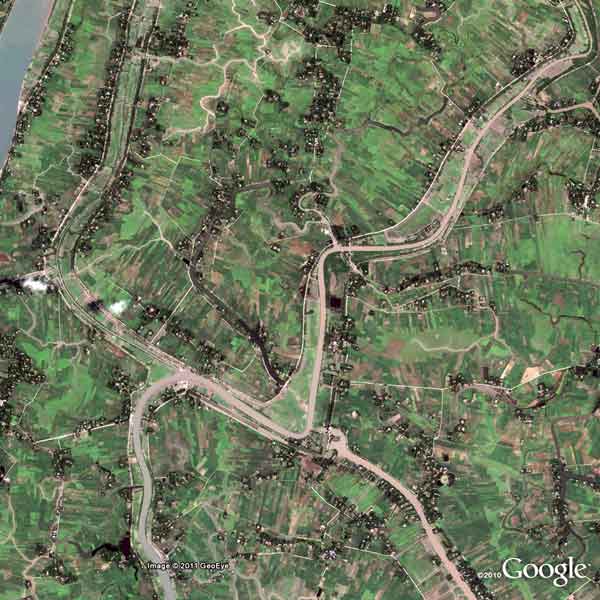
Figure 8: Population in rural Bangladesh is very high but the country’s growth rate has slowed to
1.4 per cent per year. Source: Google Earth ©2011, ©GeoEye 2011
Full Size Image
Summary of findings and implications:
World population will exceed seven billion by late 2011 or early 2012. While the rate of growth has slowed in percentage
terms, widely accepted projections of future population numbers predict the addition of 2 billion more people before the
middle of this century. These projections are based on the application of demographic-transition models, which foresee lower
birthrates for many currently developing countries. The demographic transition model clearly explains some of the most
central dynamics of population growth rates in a historical context. However, several researchers have questioned assumptions
made in the application of the demographic transition model to population projections. Among the assumptions questioned is
the assumed availability of adequate cheap energy for current development trends to continue. Finally, even if the UN and US
Census Bureau models, which predict 9.3 billion people by mid century, are accurate, many others believe that population level
dramatically overshoots the Earth's capacity to sustainably support us. How the pressures of population growth will unfold in
different regions of the globe will likely vary considerably, however; in a world of economic globalization and increasing
international interdependence, no country will be isolated from the consequences.
References
Bongaarts, J. (2009). Human population growth and the demographic transition. Philosophical Transactions of the
Royal Society – Biological Sciences 364:2985-2990.
Brown, J., Burnside, W., Davidson, A., Delong, J., Dunn, W., Hamilton, M., Mercado-Silva, N., Nekola, J., Okie, G., Woodruff ,
W. and Zuo W. (2011). Energetic Limits to Economic Growth. BioScience 61(1):19-26.
Campbell, C. and Laherrére, J. (1998). The End of Cheap Oil. Scientific American 3:78-83.
DeLong, J., Burger, O. and Hamilton M. (2010). Current Demographics Suggest Future Energy Supplies Will Be
Inadequate to Slow Human Population Growth. PLoS ONE 5(10): e13206. doi:10.1371/journal.pone.0013206
EPI. (2010). World On the Edge – Energy Data – Oil. http://www.earth-policy.org/books/wote/wote_data (Last accessed on April 20, 2011)
FAO. (2005). Mapping global urban and rural population distributions – Environment and Natural Resources Working Paper 24.
http://www.fao.org/docrep/009/a0310e/a0310e00.htm (Last accessed on April 20, 2011).
Fragkias, M. and Seto, K. (2009). Evolving rank-size distributions of intra-metrofpolitan urban clusters in
South China. Computers, Environment and Urban Systems 33:189-199.
Hall, C. and Day, J. (2009). Revisiting the Limits to Growth After Peak Oil. American Scientist 97:230-237.
Hall, C., Lindenberger, D., Kümmel, R., Kroeger, T., Eichhorn, W. (2001) The Need to Reintegrate the Natural Sciences
with Economics. BioScience 51(8):663-673.
Kremer, M. (1993). Population Growth and Technological Change: One Million B.C. to 1990. The Quarterly Journal of
Economics 108(3):681-716.
Lo, C. (1996). Environmental impact on the development of agricultural technology in China: the case of the dike-pond
('jitang') system of integrated agriculture-aquaculture in the Zhujiang Delta of China. Agriculture, Ecosystems and Environment 60:183-195.
Luci, A. and Thévenon, O. (2010). Does economic development drive the fertility rebound in OECD countries? INED working paper
167. http://www.ined.fr/fi chier/t_publication/1514/publi_pdf1_dt_167.pdf (Last accessed on April 20, 2011).
Murphy, J. and Hall C. (2011). Energy Return on investment, peak oil, and the end of economic growth. In "Ecological Economic Reviews"
R. Costanza, K. Limburg and I. Kubiszewski, eds. Ann. N.Y. Acad. Sci. 1219:52-72.
Myrskylä, M., Kohler, H. and Billari, F. (2009). Advances in development reverse fertility declines. Nature:460(6):741-743.
Nel, W. and van Zyl, G. (2010). Defining limits: Energy constrained economic growth. Applied Energy 87(1):168-177.
Norgaard, R. (1992) Sustainability and the Economics of Assuring Assets for Future Generations. World Bank Working Paper
WPS 832. Asia Regional Office. http://www-wds.worldbank.org/servlet/WDSContentServer/WDSP/IB/1992/01/01/000009265_3961003030128/Rendered/PDF/multi0page.pdf
(Last accessed on April 20, 2011).
SEDAC. (2010). Gridded Population of the World: Future Estimates. Socioeconomic Data and Applications Center (SEDAC); collaboration
with CIESIN, UN FAO,CIAT. http://sedac.ciesin.columbia.edu/gpw (Last accessed on August 10, 2010).
Seto, K. and Kaufmann, R. (2003). Modeling the Drivers of Urban Land Use Change in the Pearl River Delta, China: Integrating
Remote Sensing with Socioeconomic Data. Land Economics 79(1):106-121.
Sun, Q., Tan, J. and Zu, Y. (2010). An ERDAS image processing method for retrieving LST and describing urban heat
evolution: a case study in the Pearl River Delta Region in south China. Environmental Earth Science 59:1047-1055.
Tuljapurkar, S., (2009). Babies make a comeback. Nature 460(6): 693-694.
UN. (2002). Johannesburg Declaration on Sustainable Development. http://www.un.org/esa/sustdev/documents/WSSD_POI_PD/English/POI_PD.htm
(Last accessed on April 19, 2011).
UN. (2009). World Urbanization Prospects: The 2009 Revision. http://esa.un.org/unpd/wup/index.htm (Last accessed on September 29, 2010).
UNPD (2011a). World Population Prospects, 2010 Revision. United Nations Population Divisions.
http://esa.un.org/unpd/wpp/unpp/ panel_population.htm (Last accessed on May 10, 2011)
UNPD. (2011b). United Nations, Department of Social Aff airs, Population Division, World Contraceptive Use 2010.
http://www.un.org/ esa/population/publications/wcu2010/Main.html (Last accessed on April 19, 2011).
U.S. Census Bureau. (2010). International Data Base, Population Estimates and Projections Methodology.
http://www.census.gov/ipc/www/idb/estandproj.pdf (Last accessed on April 19, 2011).
US Census Bureau (2011) U.S. Census Bureau, International Data Base. http://www.census.gov/ipc/www/idb/worldpopinfo.php
(Last accessed on April 19, 2011).
USDA. (2010). Economic Research Service, United States Department of Agriculture. International Macroeconomic Data Set.
http://www.ers.usda.gov/Data/Macroeconomics/ (Last accessed on April 20, 2011).
Valentine, S. (2010). Disarming the population bomb. International Journal of Sustainable Development & World Ecology. 17(2):120-132.
Weng, Q. (2007). A historical perspective of river basin management in the Pearl River Delta of China. Journal of
Environmental Management 85:1048-1062
World Bank. (2011a). World Bank, World Development Indicators.
http://www.google.com/publicdata?ds=wb-wdi&met=sp_ pop_grow&idim=country:RWA &dl=en&hl=en&q=rwanda+population+growth
(Last accessed on February 28, 2011)
World Bank. (2011b). World Development Indicators & Global Development Finance. Accessed April 20, 2011
at: http://data.worldbank.org/data-catalog/worlddevelopment-indicators
Yan, H., Liu, J., Huang, H.Q., Tao, B. and Cao, M. (2009) Assessing the consequence of land use change on agricultural
productivity in China. Global and Planetary Change 67:13-19.
Information is regularly scanned, screened, filtered, carefully edited, and published for
educational purposes. UNEP does not accept any liability or responsibility for the accuracy, completeness, or any other quality of information and
data published or linked to the site. Please read our privacy policy and
disclaimer for further information.
|


