|
Having trouble reading this email?
Download the PDF.

Thematic focus: Harmful substances and hazardous waste, ecosystem management
Forecasting and early warning of dust storms
Why is this issue important?
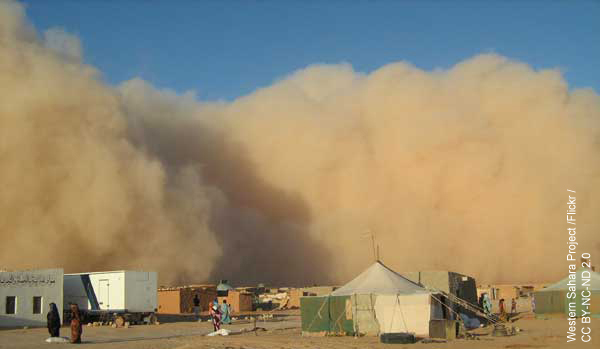
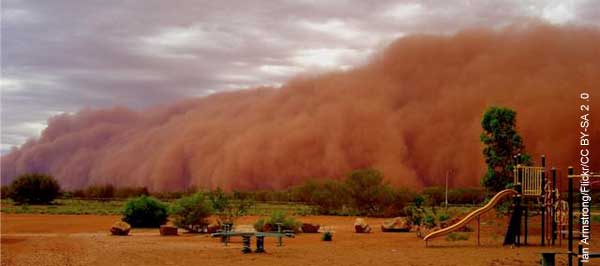
Soon after a massive dust storm engulfed Sydney, Australia in September 2009, the worst the city had experienced since 1940
(Leys et al., 2011), a call was made for the development of more early warning systems to be able to predict these
devastating events in the future (UN, 2009). The city was covered in dust for nine hours and suffered disruption to
communications, daily activities, car and air traffic, and reduced visibility to 0.4 km (Leys et al., 2011).
Impacts such as these can be quite common during a dust event and can result in great costs. Other impacts can
include the deposition of foreign sediments causing cropland to suffer; compromised air quality and human health when
dust particles remain suspended in the atmosphere; and reduced efficiency of renewable energy sources when dust interferes
with their mechanics. Suspended dust particles can alter the atmospheric radiation balance and contribute to climatic
variations (Du et al., 2002) such as alteration of regional monsoon patterns or the acceleration of glacial melt (Gautam et al., 2010).
Dust storms can have high interannual, as well as annual and decadal, variability, thus it is important that more research is
conducted over longer periods of time to analyze trends and associated storm severity (Ganor et al., 2010; Goudie, 2009). With
increased information about long term trends, more accurate forecasts of dust storm movements can be developed, the appropriate
efforts to mitigate damage can be put into place and effective early warning can be communicated.
What are the findings?
What causes a dust storm?
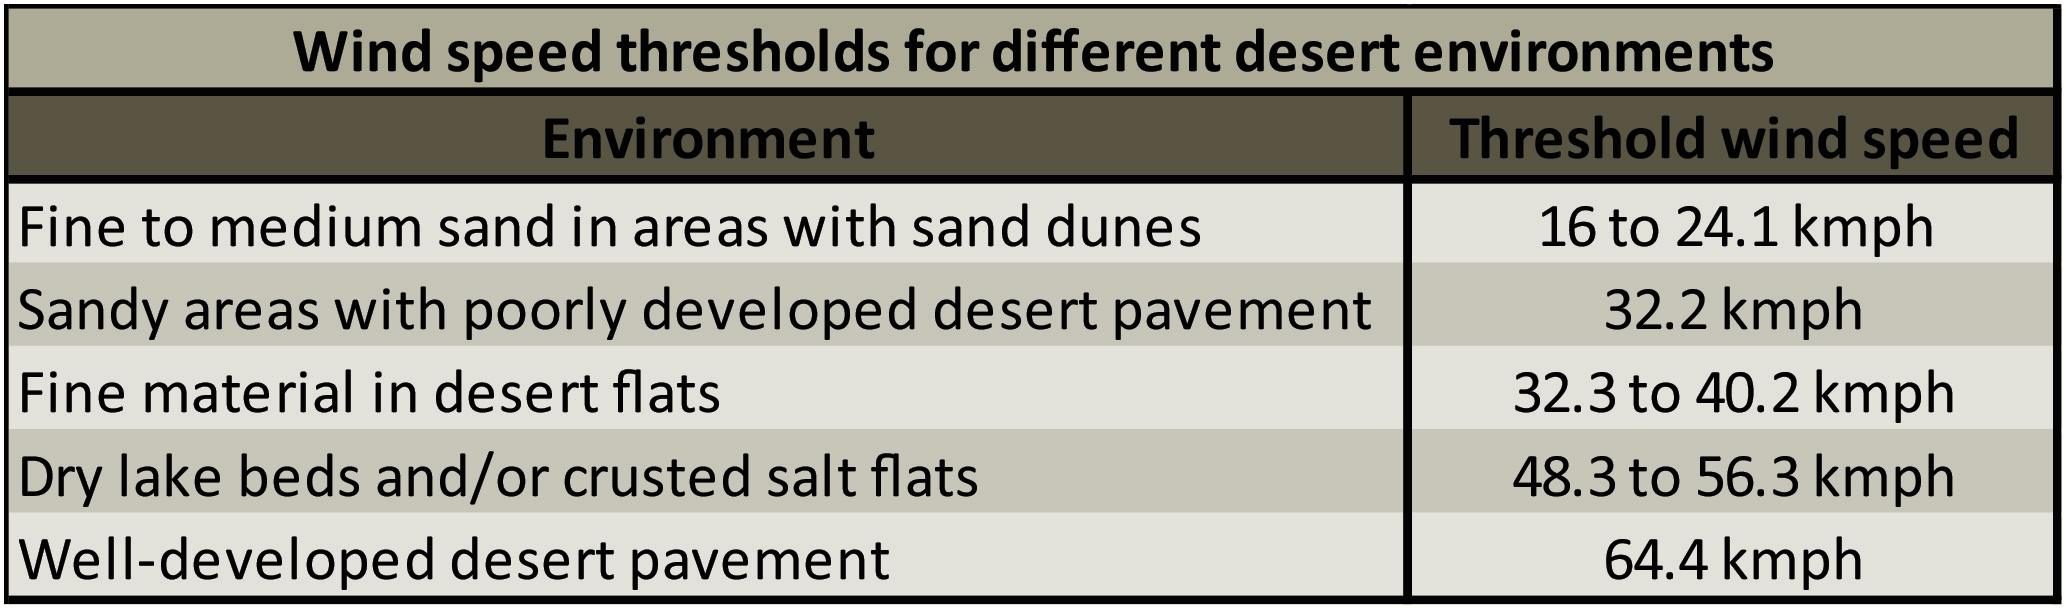
When high winds at a threshold speed (Table 1) blow over areas with minimal vegetation cover, soils that lack
snow and/or soil moisture content (NRL, 2009), or soils that are vulnerable to surface disturbance (Wilcox, 2012)
a dust storm has the potential to occur. Other types of areas that can also be vulnerable to a dust storms
when threshold winds are present are areas in which soils have dried out and displaced after a flash flooding
event (UCAR/COMET, 2010) or areas with dried out lakebed sediments.
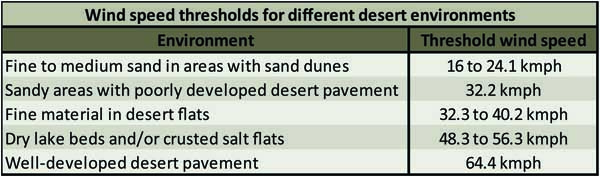
Table 1. Wind speed thresholds for different desert environments. Wind speed threshold refers to
the minimum wind speed required to lift suspended sediment in a certain environment (UCAR/COMET, 2010).
Full Size Image
Desert soils are naturally resistant to wind erosion because they form a thin cohesive surface crust that helps to keep the soils intact.
The crust is most prevalent in areas between plants because they help to stabilize and protect soil from wind and can trap suspended soil
particles (Urban et al., 2009; Steenburgh et al., 2012; Wilcox, 2012). When the crust is disturbed or there is a reduction in vegetation
cover, the risk of a dust storm occurrence is increased as the loosened sediments are free to be picked up by high winds. Land degrading
events such as overgrazing of livestock and clearing of land for agricultural or infrastructure development are common sources of soil
disturbance. Dust and sand from storm events can also bury crops blocking sunlight and damaging plant tissue, thus inhibiting future
growth (Sivakumar, 2005). If crops do not recover from such an event, then the resulting barren field becomes fuel for the next dust
storm. A brief life cycle of a dust storm, and how one can fuel itself, is described in Figure 1.
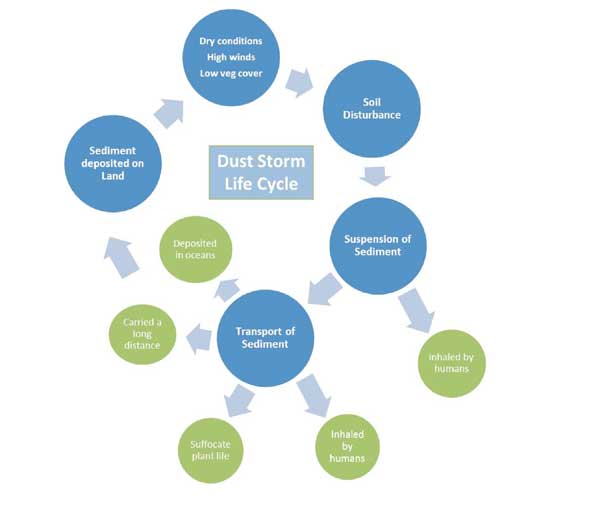
Figure 1. Dust Storm Life Cycle. This simplified diagram of the life cycle of a dust
storm and its impacts illustrate how a dust storm can fuel itself.
Full Size Image
Where and when do dust storms occur?
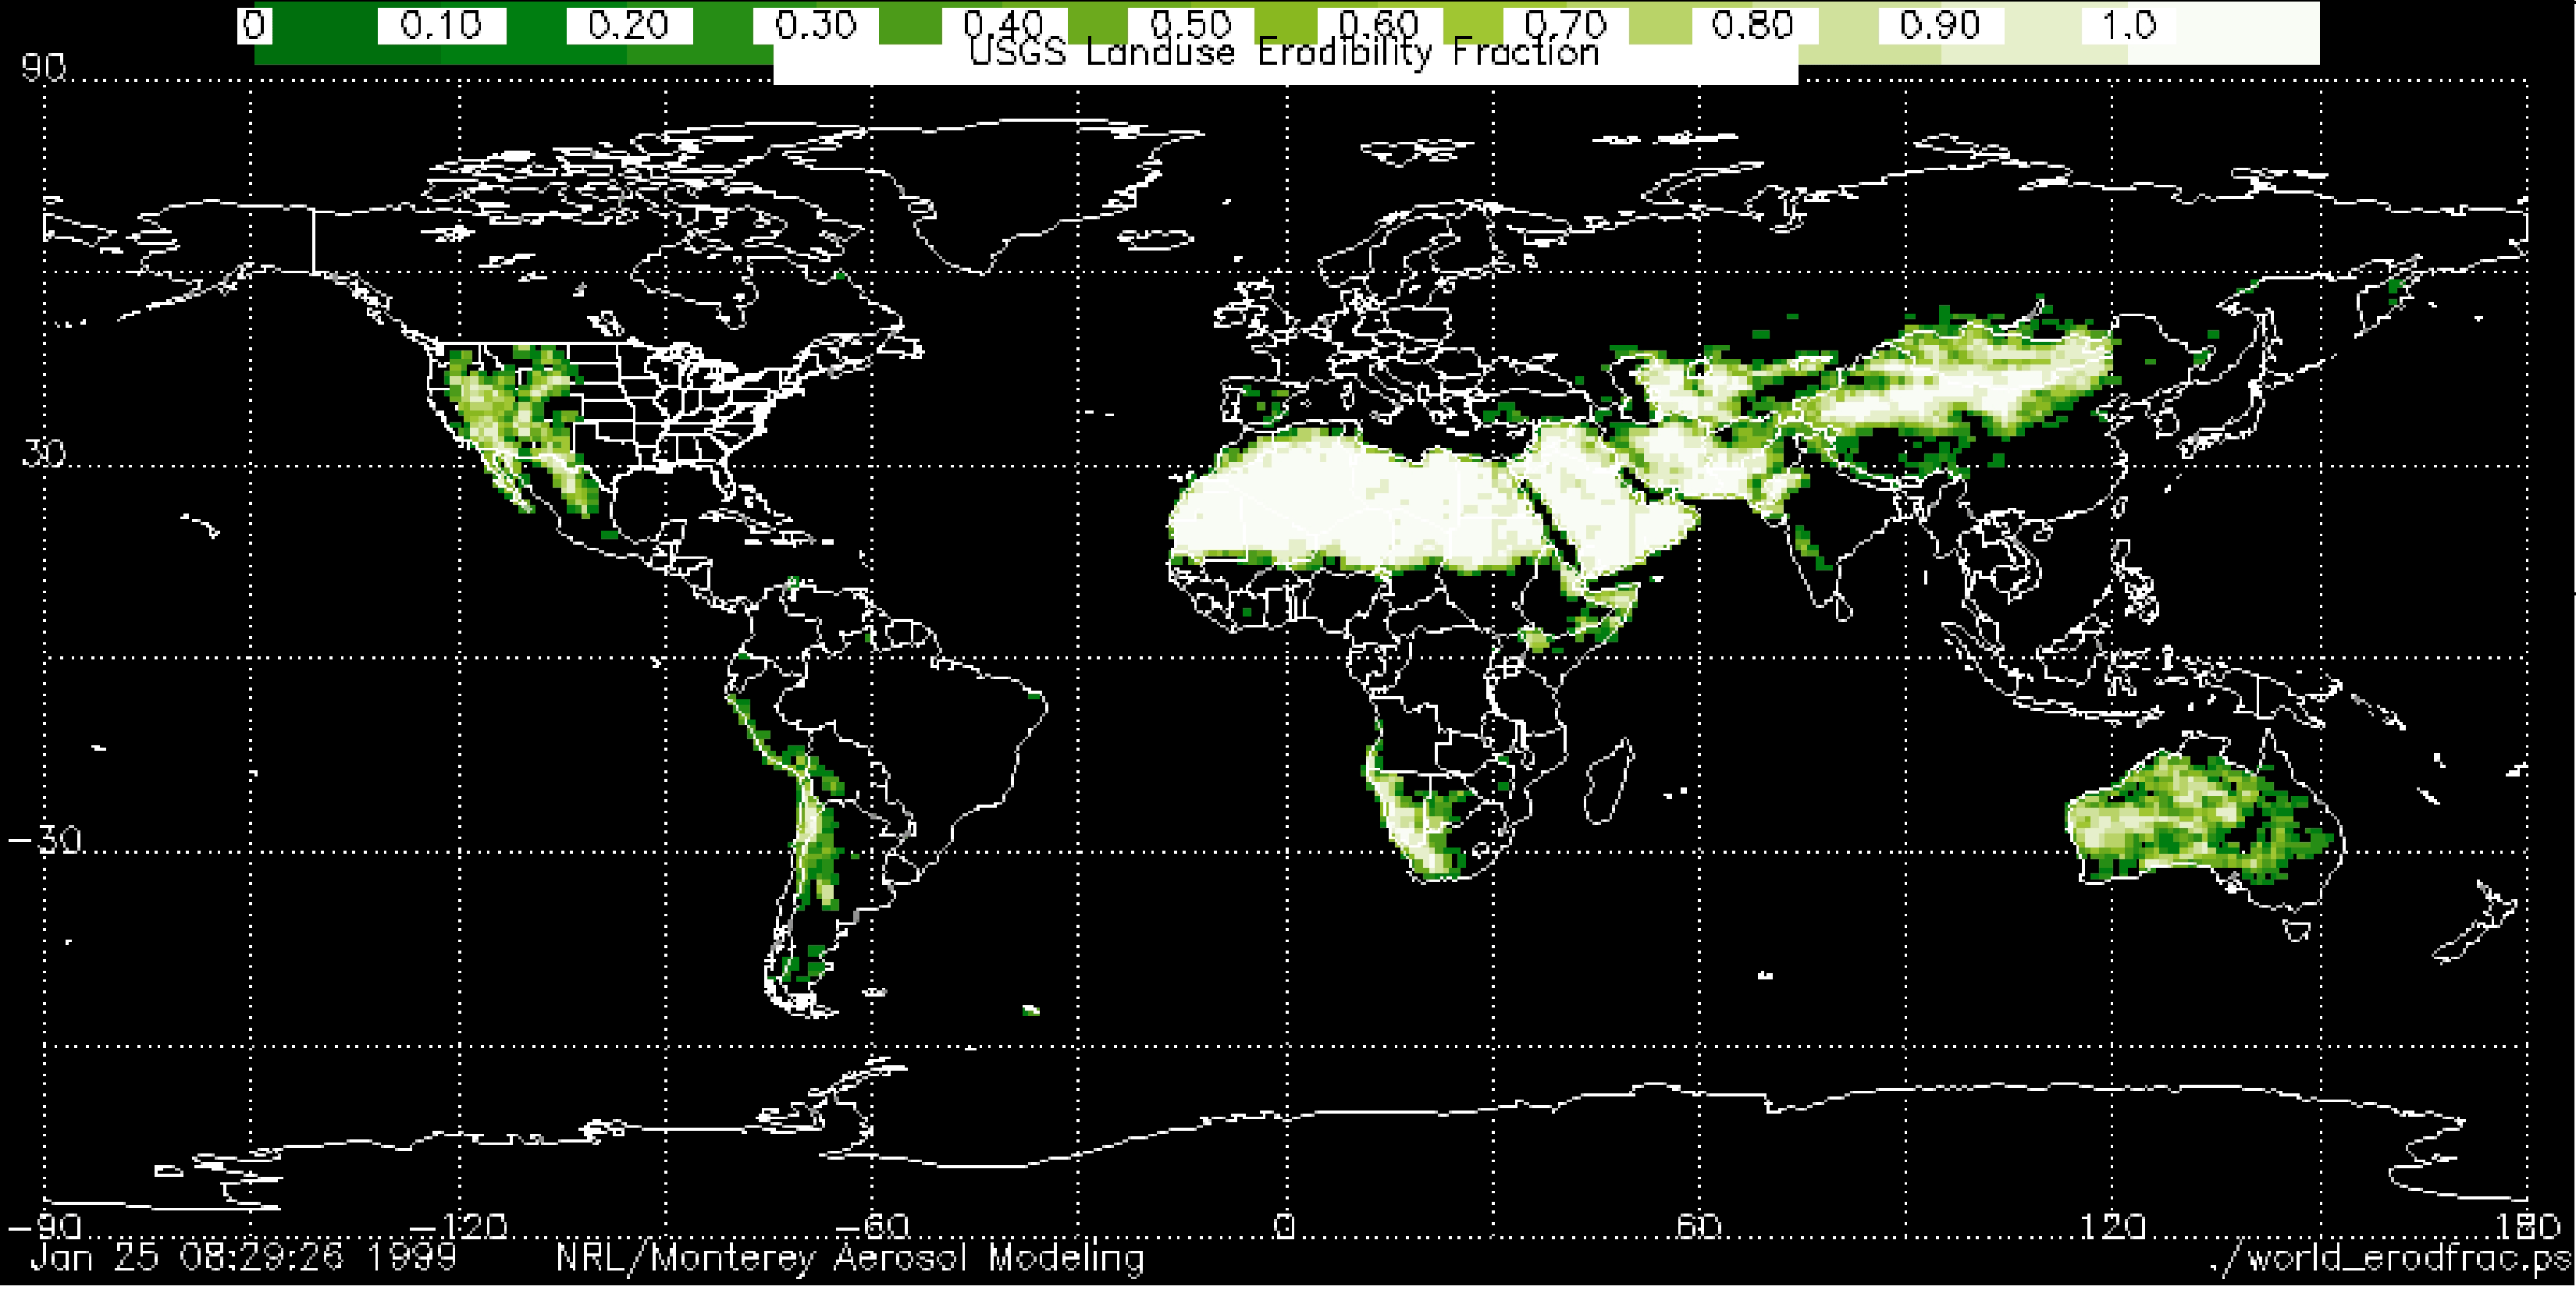
The primary dust producing regions on earth are classified as some type of a desert with minimal saturation as indicated
by a high erodible fraction value (Figure 2). These regions are the Sahara Desert, the Middle East (Figure 3), the
Taklamakan Desert in northwest China, southwest Asia, central Australia, the Etosha and Makgadikgadi basins of southern Africa,
the Salar de Uyuni (Bolivia) and the Great Basin (USA) (NRL, 2009; Washington et al., 2003). Topographically, most of these
regions encompass a large basin with an internal drainage system and are prone to high winds that facilitate dust mobilisation
(Washington et al., 2003). Dust storms can occur on less than 40 days a year such as in the United States (NCDC/NOAA, 2012)
or on more than 100 days a year such as in parts of Mongolia (Dagvadorj et al., 2009). Dust storms from around the world
emit an estimated 1000 to 3000 teragrams per year (Tg/year) of dust into the atmosphere; the Sahara Desert region is the single
largest contributing region with estimated dust emissions of 500 to 1000 Tg/yr (Goudie, 2009).
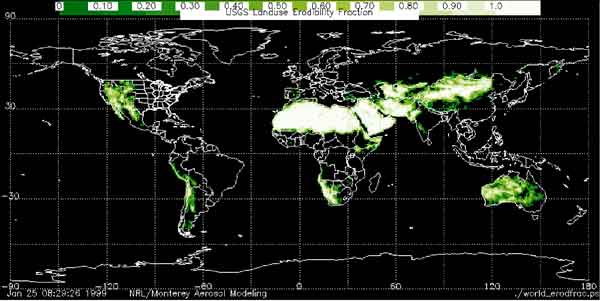
Figure 2. Historically regarded global dust producing regions (NRL 2009).
Highlighted areas represent regions with a higher erodible fraction, a value that considers land cover type and the associated wetness value of the area.
Full Size Image
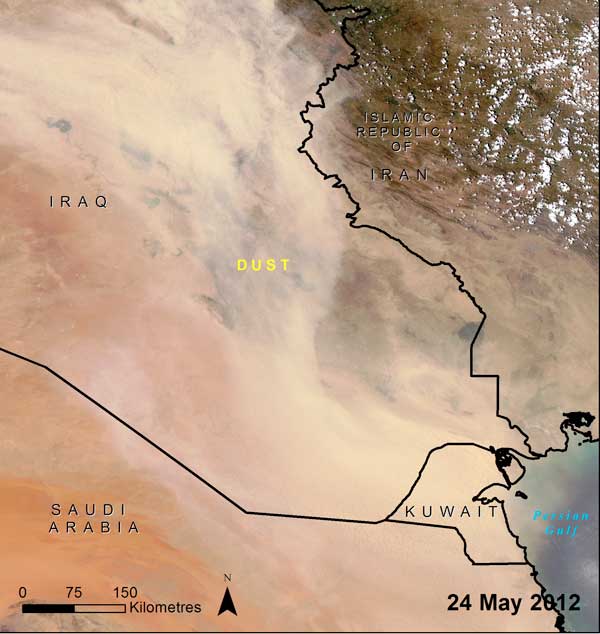
Figure 3. Dust blowing south from Syria over Iraq, Kuwait, and slightly clouding the Persian Gulf.
Image acquired on 24 May 2012 by the Moderate Resolution Imaging Spectrometer (MODIS) on NASAa Aqua satellite (image courtesy Jeff Schmaltz in Scott, 2012;
visualisation by UNEP/GRID-Sioux Falls).
Full Size Image
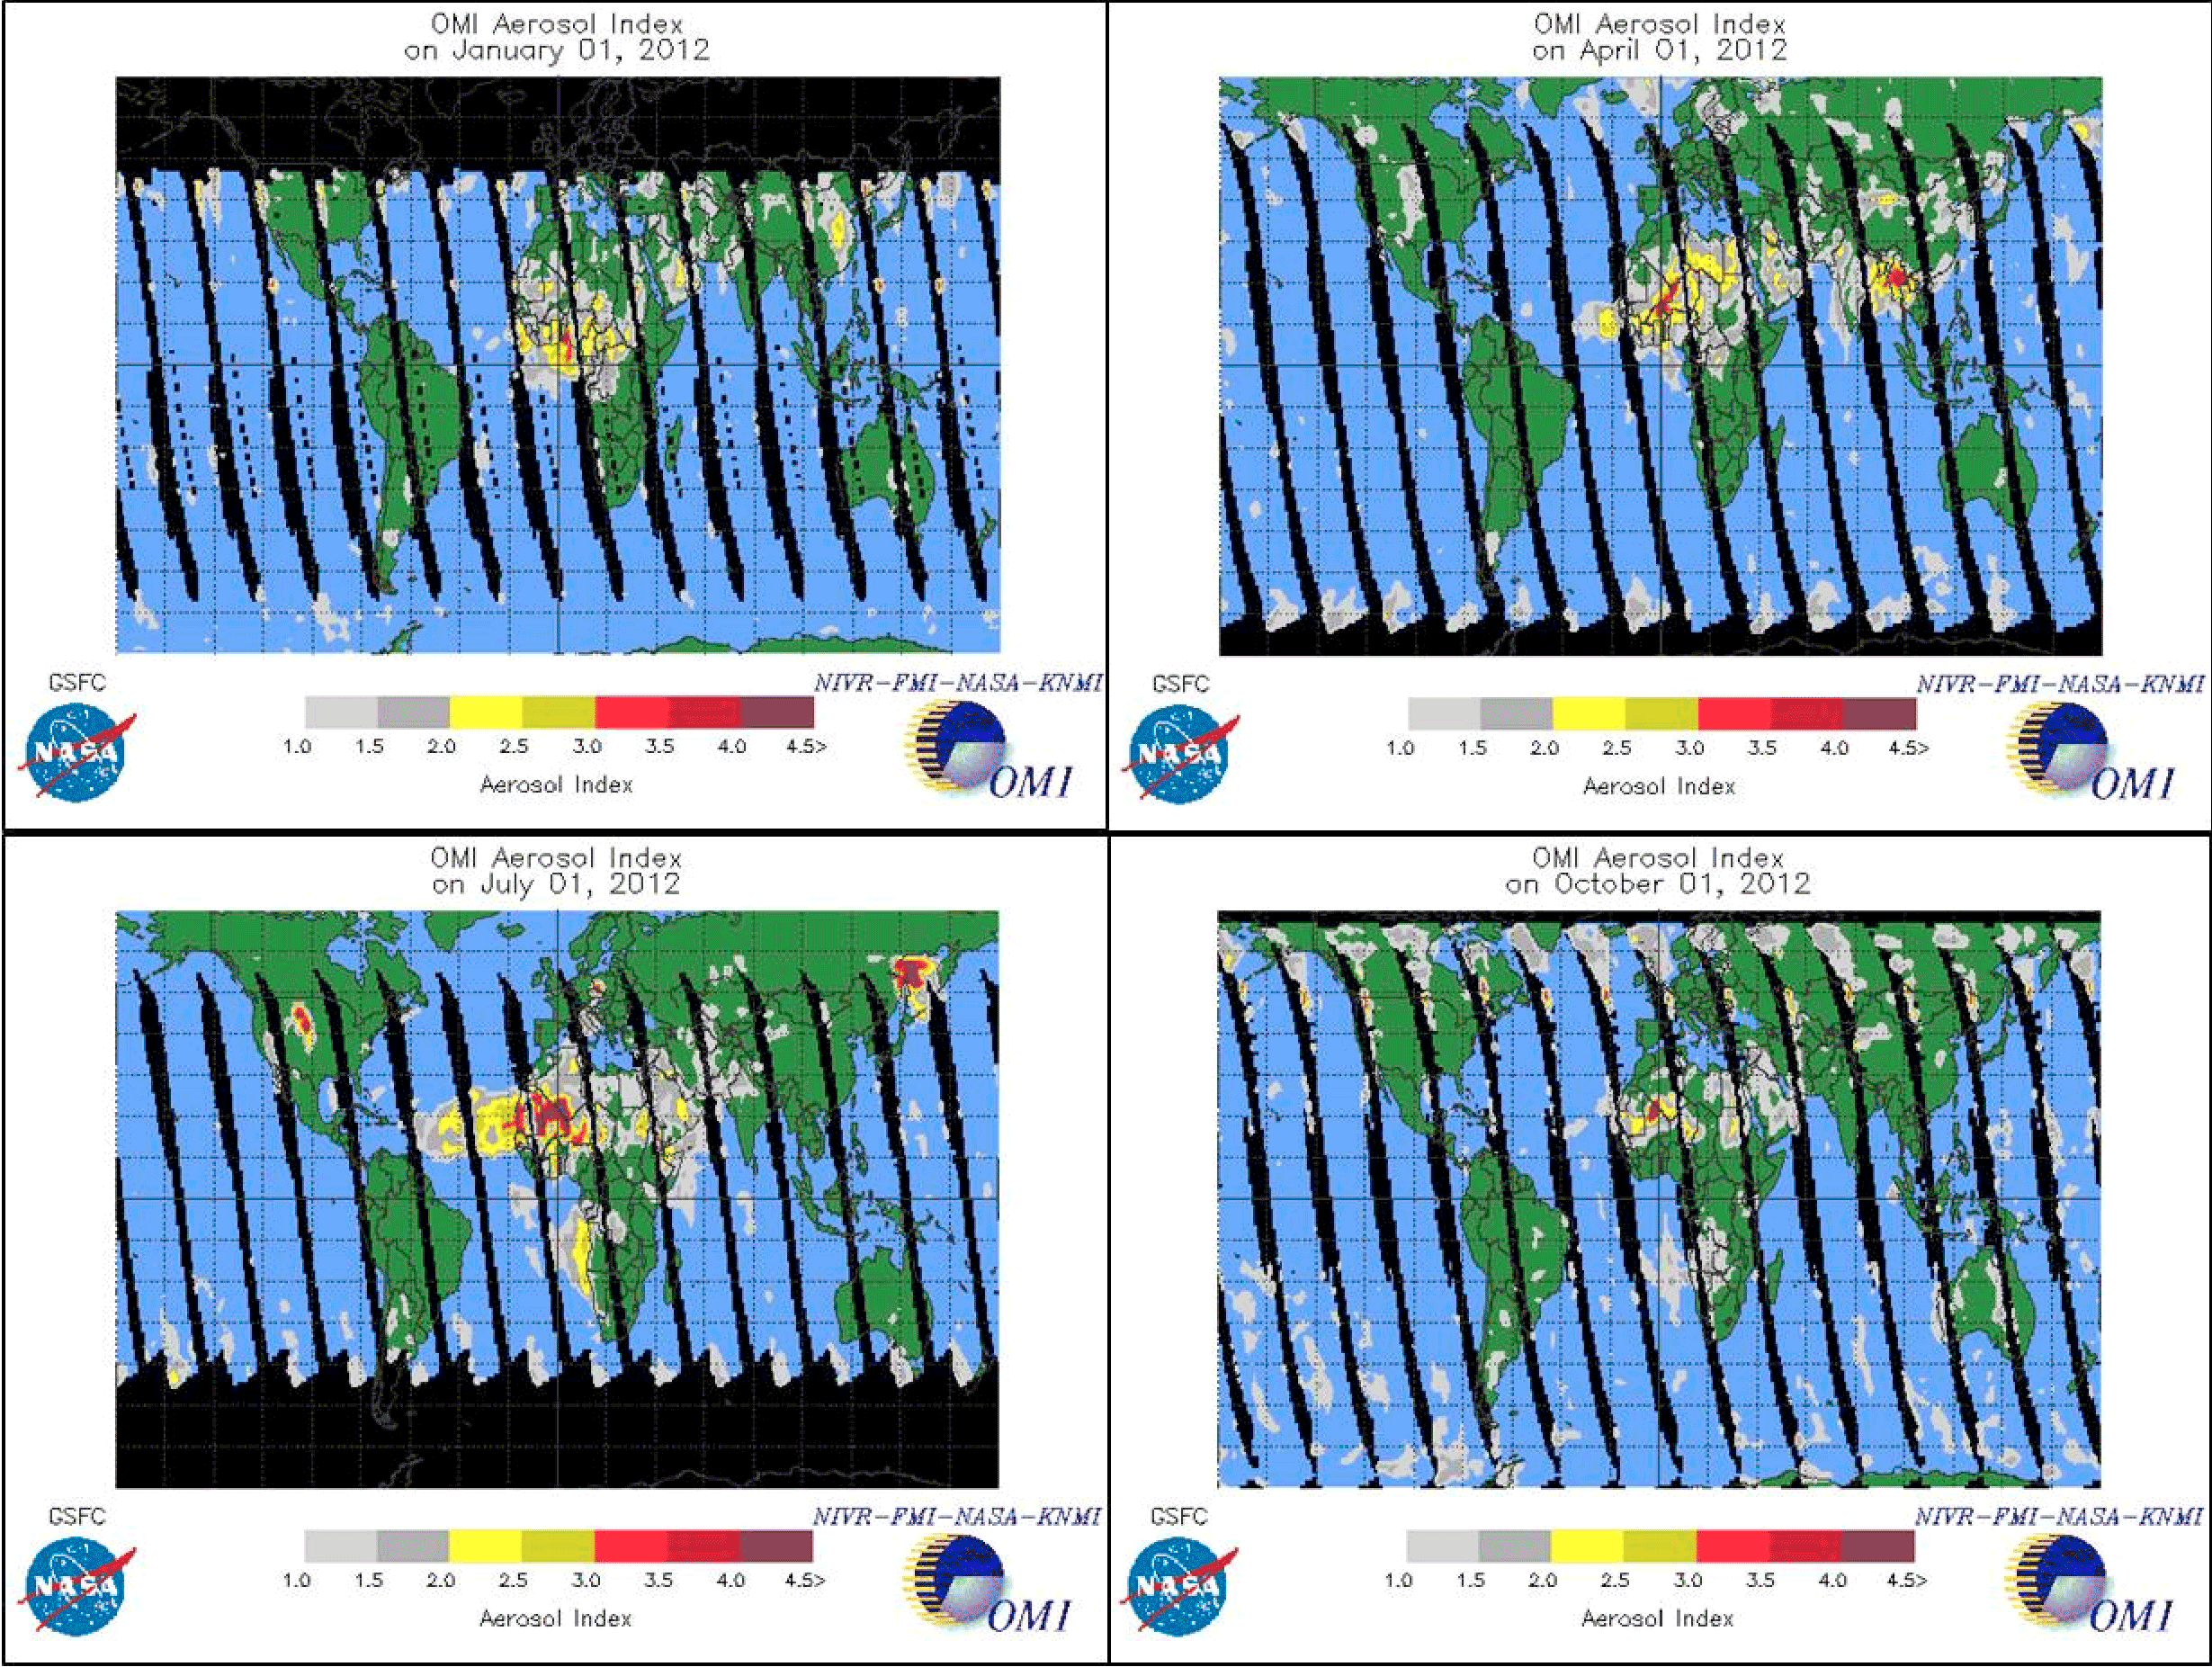
Some regions are continual dust producers year round, but dust intensity in other regions can be influenced by seasonal changes.
Large scale seasonal weather systems such as El Niño or La Niña or smaller regional patterns such as an influx of rainfall
or excessive snowmelt can influence the severity of dust events. One way of identifying seasonal fluctuations in dust
concentration is by looking at the global aerosol index (Figure 4). The aerosol index (AI) is a measurement of absorbing
aerosol particles such as dust and smoke and is commonly used to identify dust source areas (NRL, 2009; Washington et al., 2003).
The AI is obtained using NASA's Ozone Monitoring Instrument (OMI) on NASA's Earth Observing Satellite Aura (NASA, n.d).
For example, the image from 1 April 2012 shows evidence that the aerosol index is much higher in India and East Asia during
its spring season than in any other season. Intensity over India decreases by July, which coincides with its monsoon season
that brings air-clearing rains (Gautam et al., 2010).
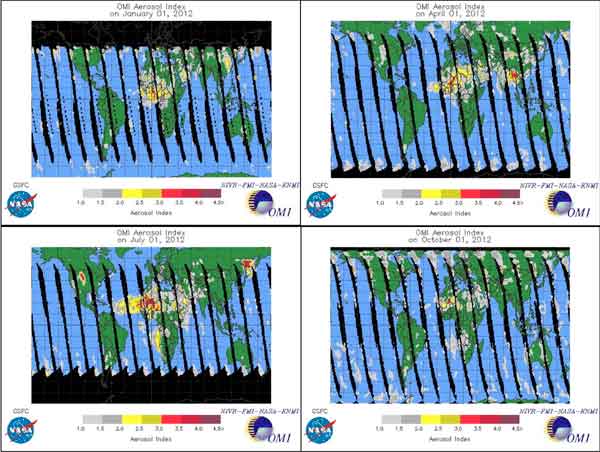
Figure 4. Global OMI Aerosol Index images from 1 January 2012, 1 April 2012,
1 July 2012 and 1 October 2012 (NASA, 2012b).
Full Size Image
What are the implications for policy?
Travelling dust: a transboundary issue
A dust storm can not only impact the area surrounding its origin, but can also impact land and people a great distance away
where the dust finally settles. Trade winds can carry dust originating in the Sahara Desert north to Spain and the United
Kingdom as well as across the Atlantic Ocean to the east coast of the United States of America (USA), Central America, and
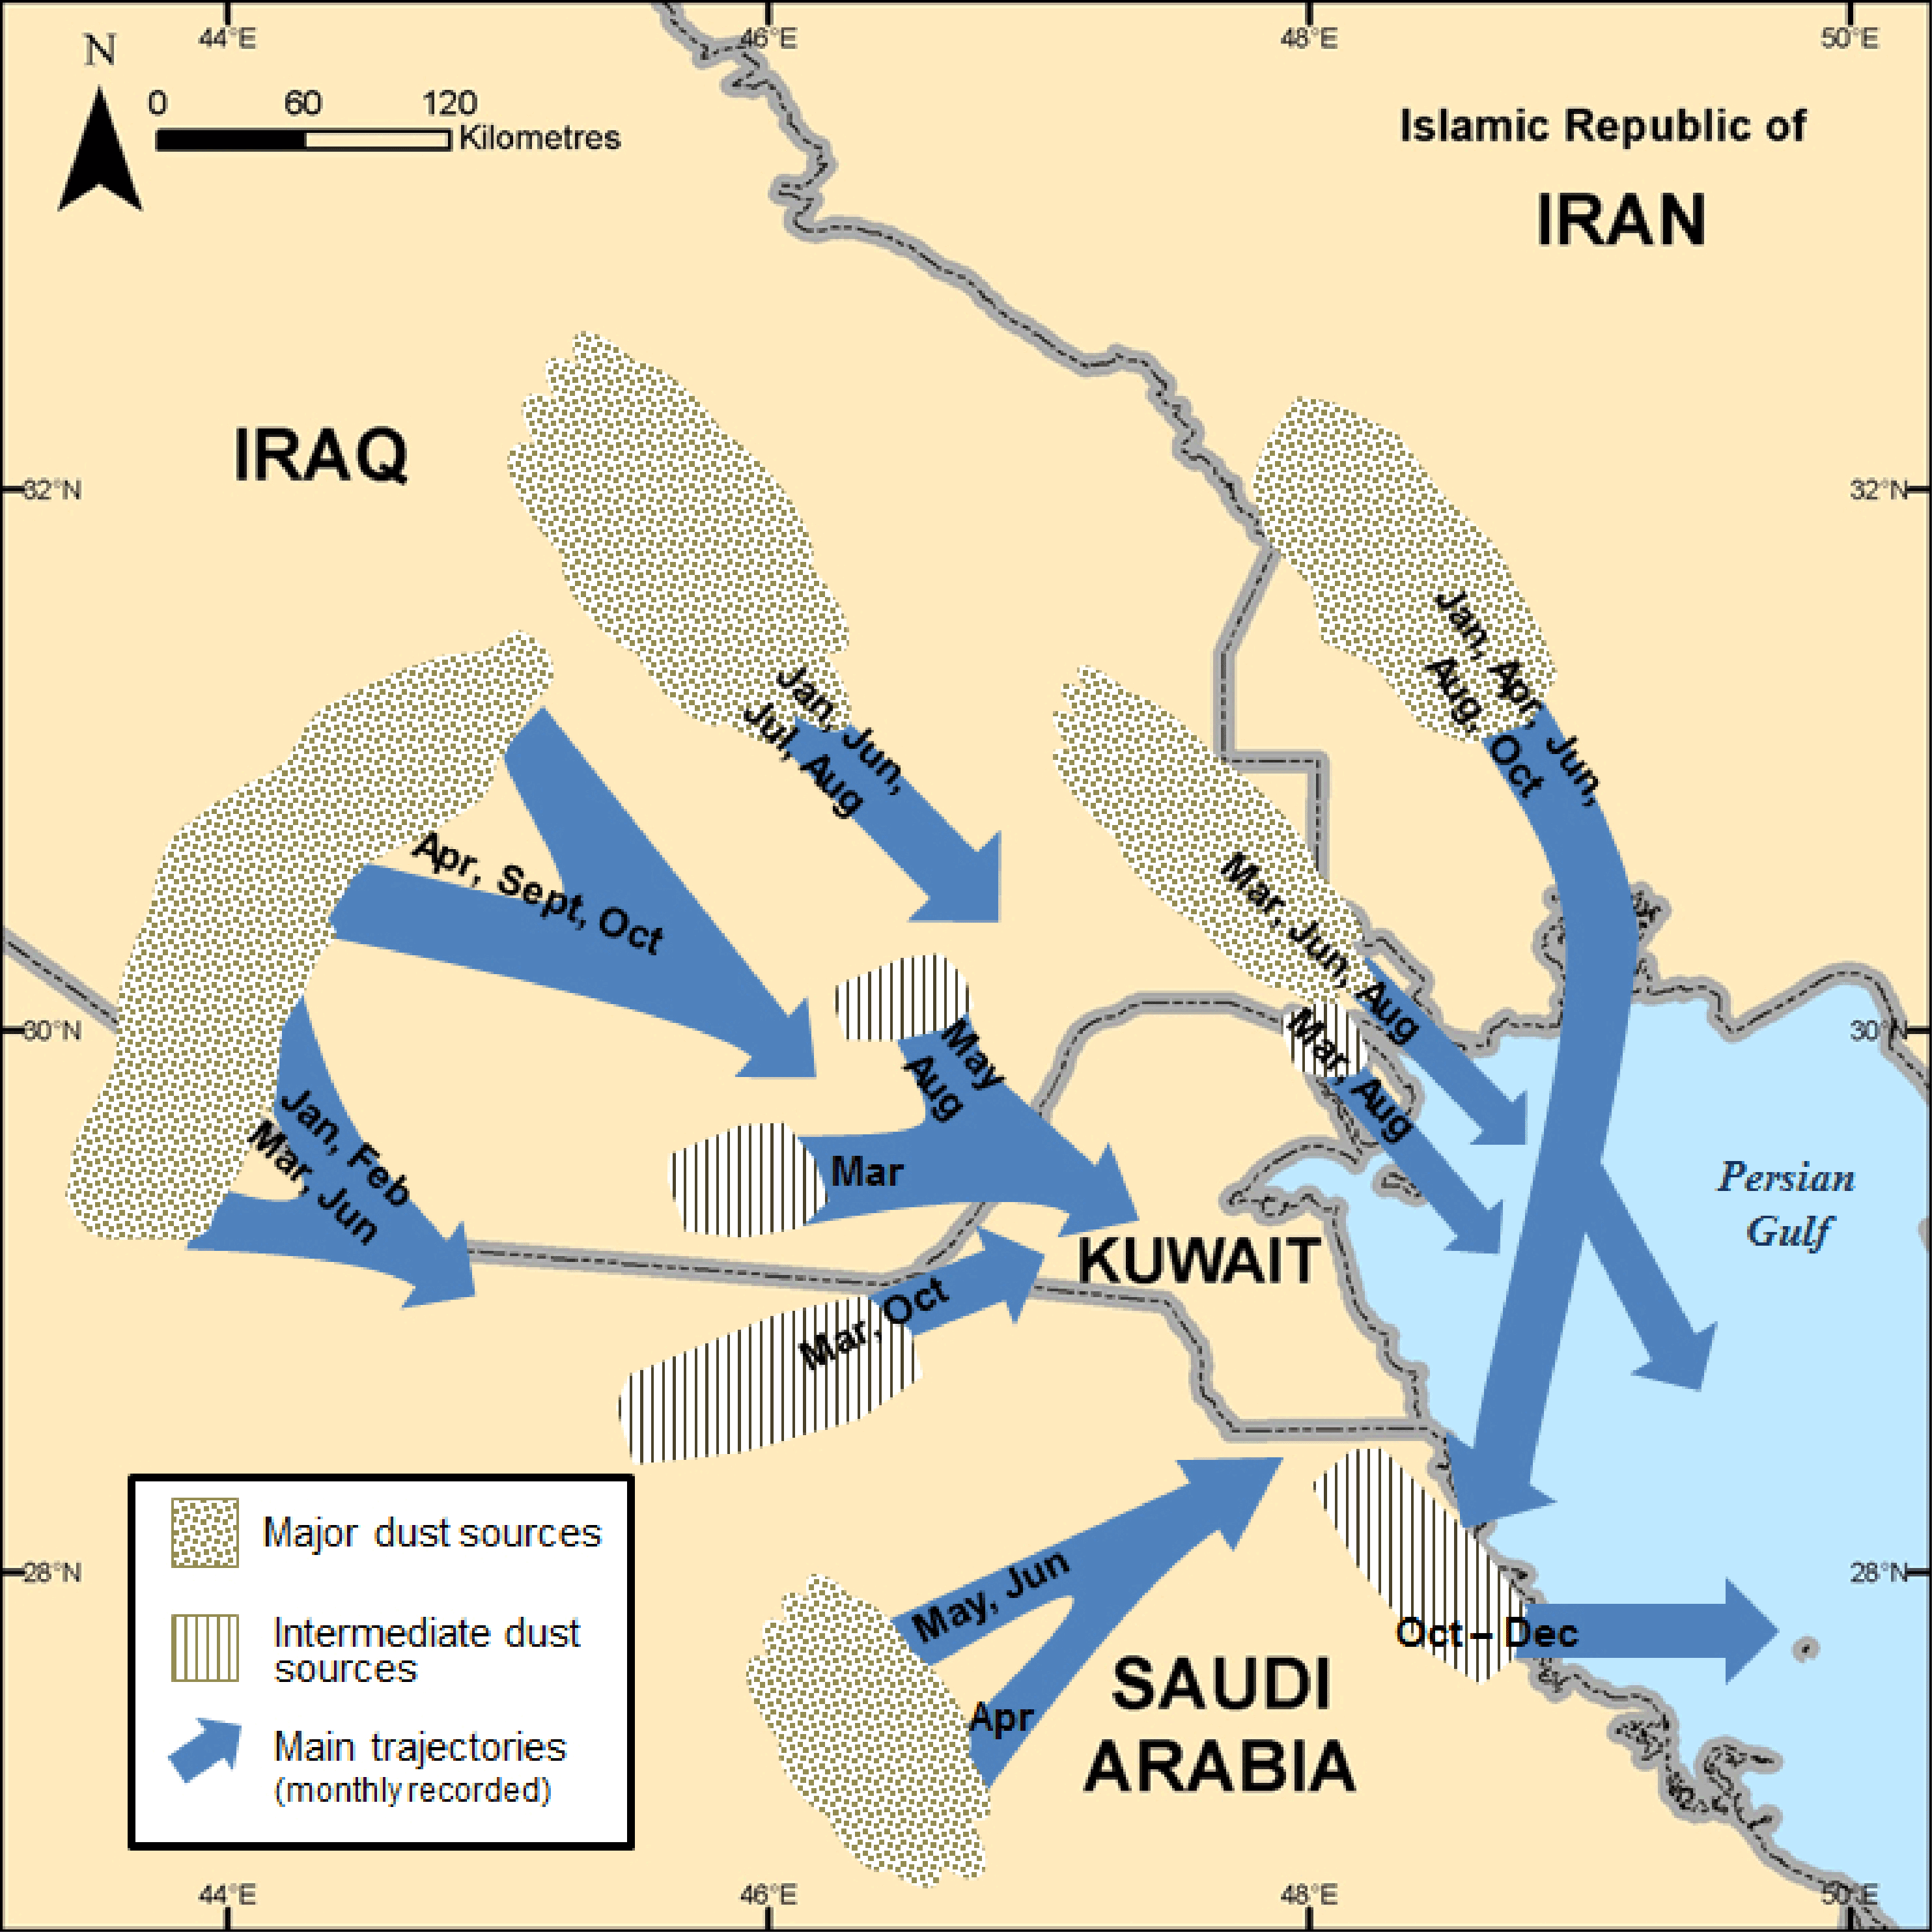
South America. Several countries surrounding the Arabian Gulf transport dust across the Gulf at various times of the year (Figure 5).
Dust originating in inner and southern Mongolia and northern China can be carried to Japan, the Democratic People's Republic of
Korea (DPRK), the Republic of Korea and the Taiwan Province of China causing yellow sands and muddy rains (Lee and Liu, 2004; Kimura,
2012a; Kimura, 2012b). Dust storms originating in eastern Australian have been known to settle across the Tasman Sea in New
Zealand (Marx et al., 2009). Therefore, many countries or entire regions may be affected and this can cause difficulty when
creating policies pertaining to dust storm mitigation (i.e. vegetation restoration efforts) or early warning communication.
These transboundary movements can pose challenges when formulating policies pertaining to dust storm mitigation (i.e.
vegetation restoration efforts) or early warning communication.
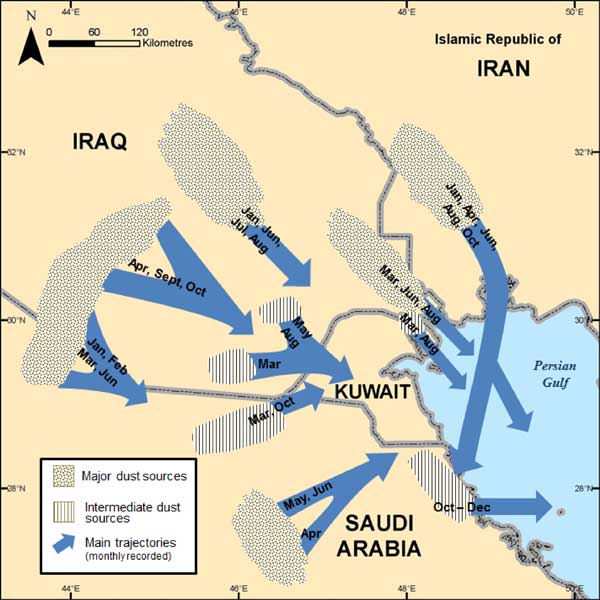
Figure 5. Approximate locations of major and intermediate sources of dust and
their corresponding trajectories over areas northwest of the Persian Gulf (Al-Dousari and Al-Awadhi, 2012; visualisation by UNEP/GRID-Sioux Falls)
Full Size Image
Long distance travel of dust from the Sahara Desert
A dust storm originating in the Sahara Desert blew over the Canary Islands and the Atlantic Ocean on 25 June 2012 (Figure 6).
This dust storm persisted for several days and reportedly travelled as far north as the United Kingdom by 28 June where it
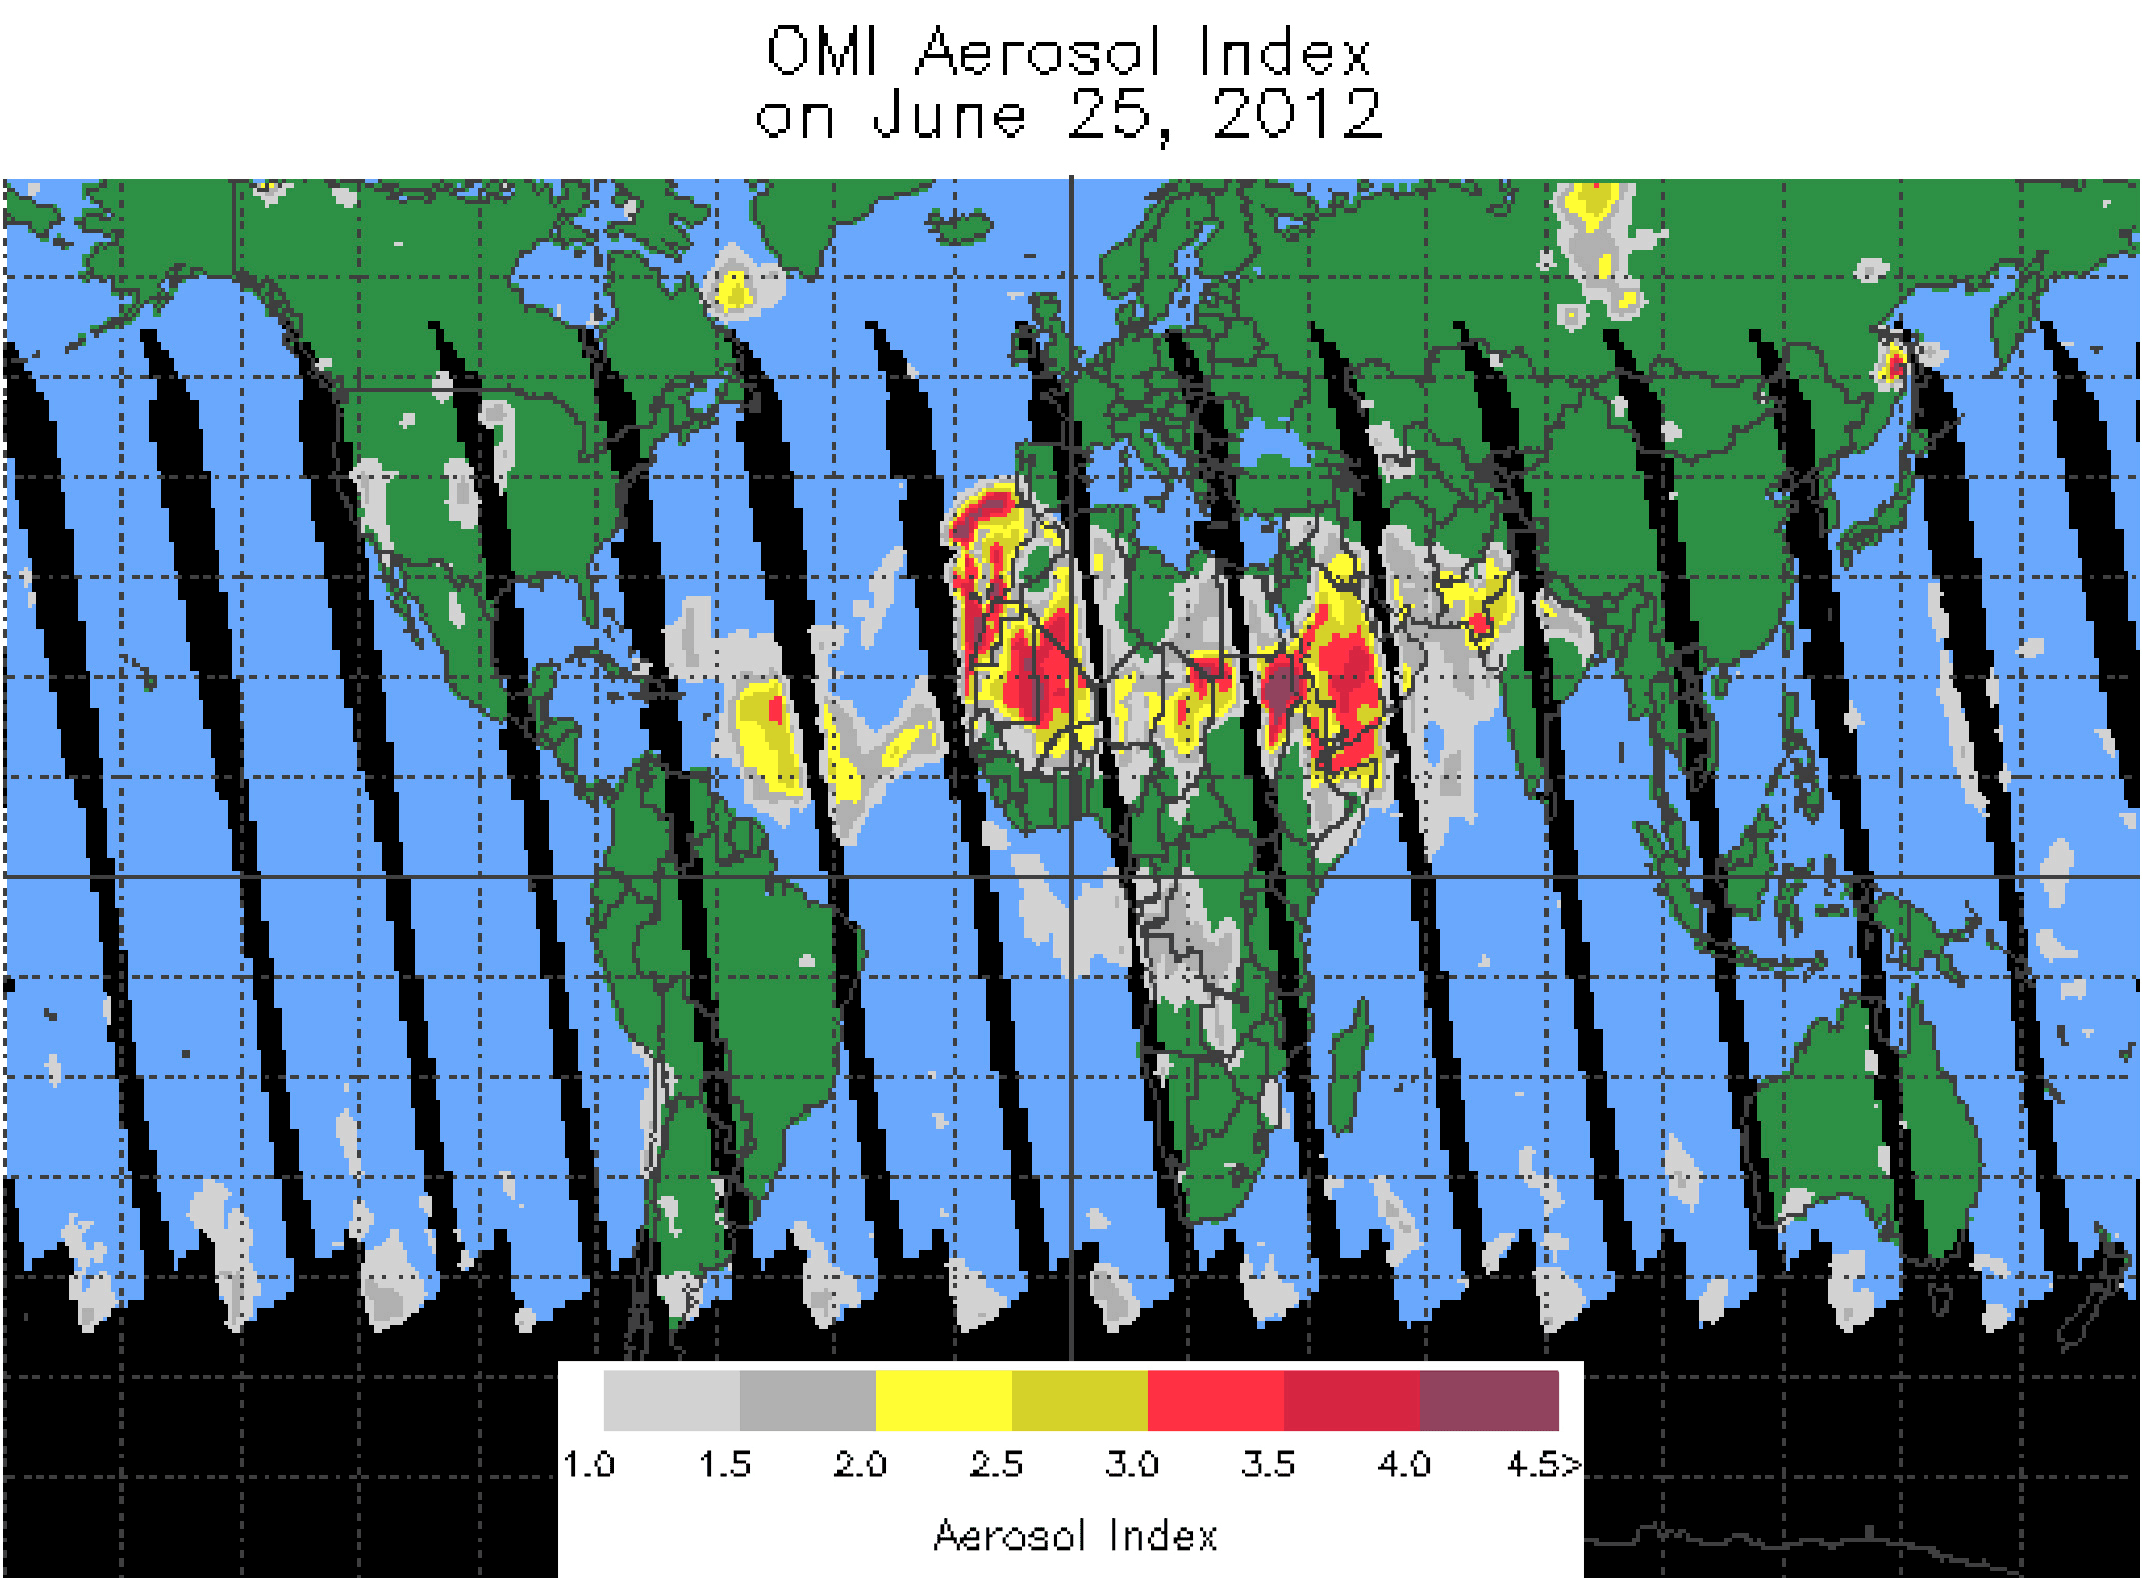
covered cars and other surfaces with a thin layer of dust (Met Office, 2012). The corresponding global aerosol index image for
25 June 2012 (Figure 7) provides insight as to how much of a wider region may also have been affected by dust in the atmosphere.
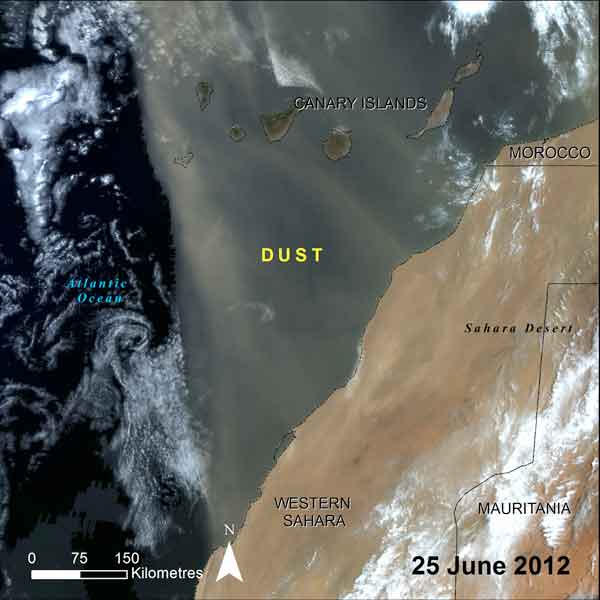
Figure 6. Dust from the Sahara Desert blowing over the Atlantic Ocean
and the Canary Islands. Image acquired on 25 June 2012 by MODIS on NASAs Terra satellite (NASA image; visualisation by UNEP/GRID-Sioux Falls).
Full Size Image
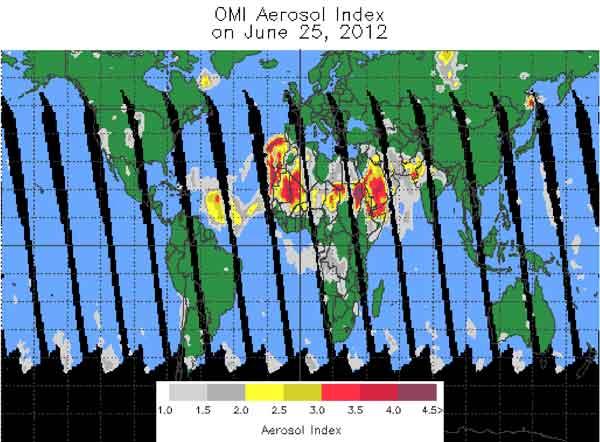
Figure 7. Global OMI Aerosol Index Image from 25 June 2012 (NASA, 2012b).
Full Size Image
Yellow Sands in Japan
Each spring Japan is plagued with yellow sands as a result of dust storms that originate in northeast Asia, notably the
Taklamakan Desert and Loess Plateau in China and the Gobi Desert in southern Mongolia, and Inner Mongolia (Lee and Liu, 2004; NASA,
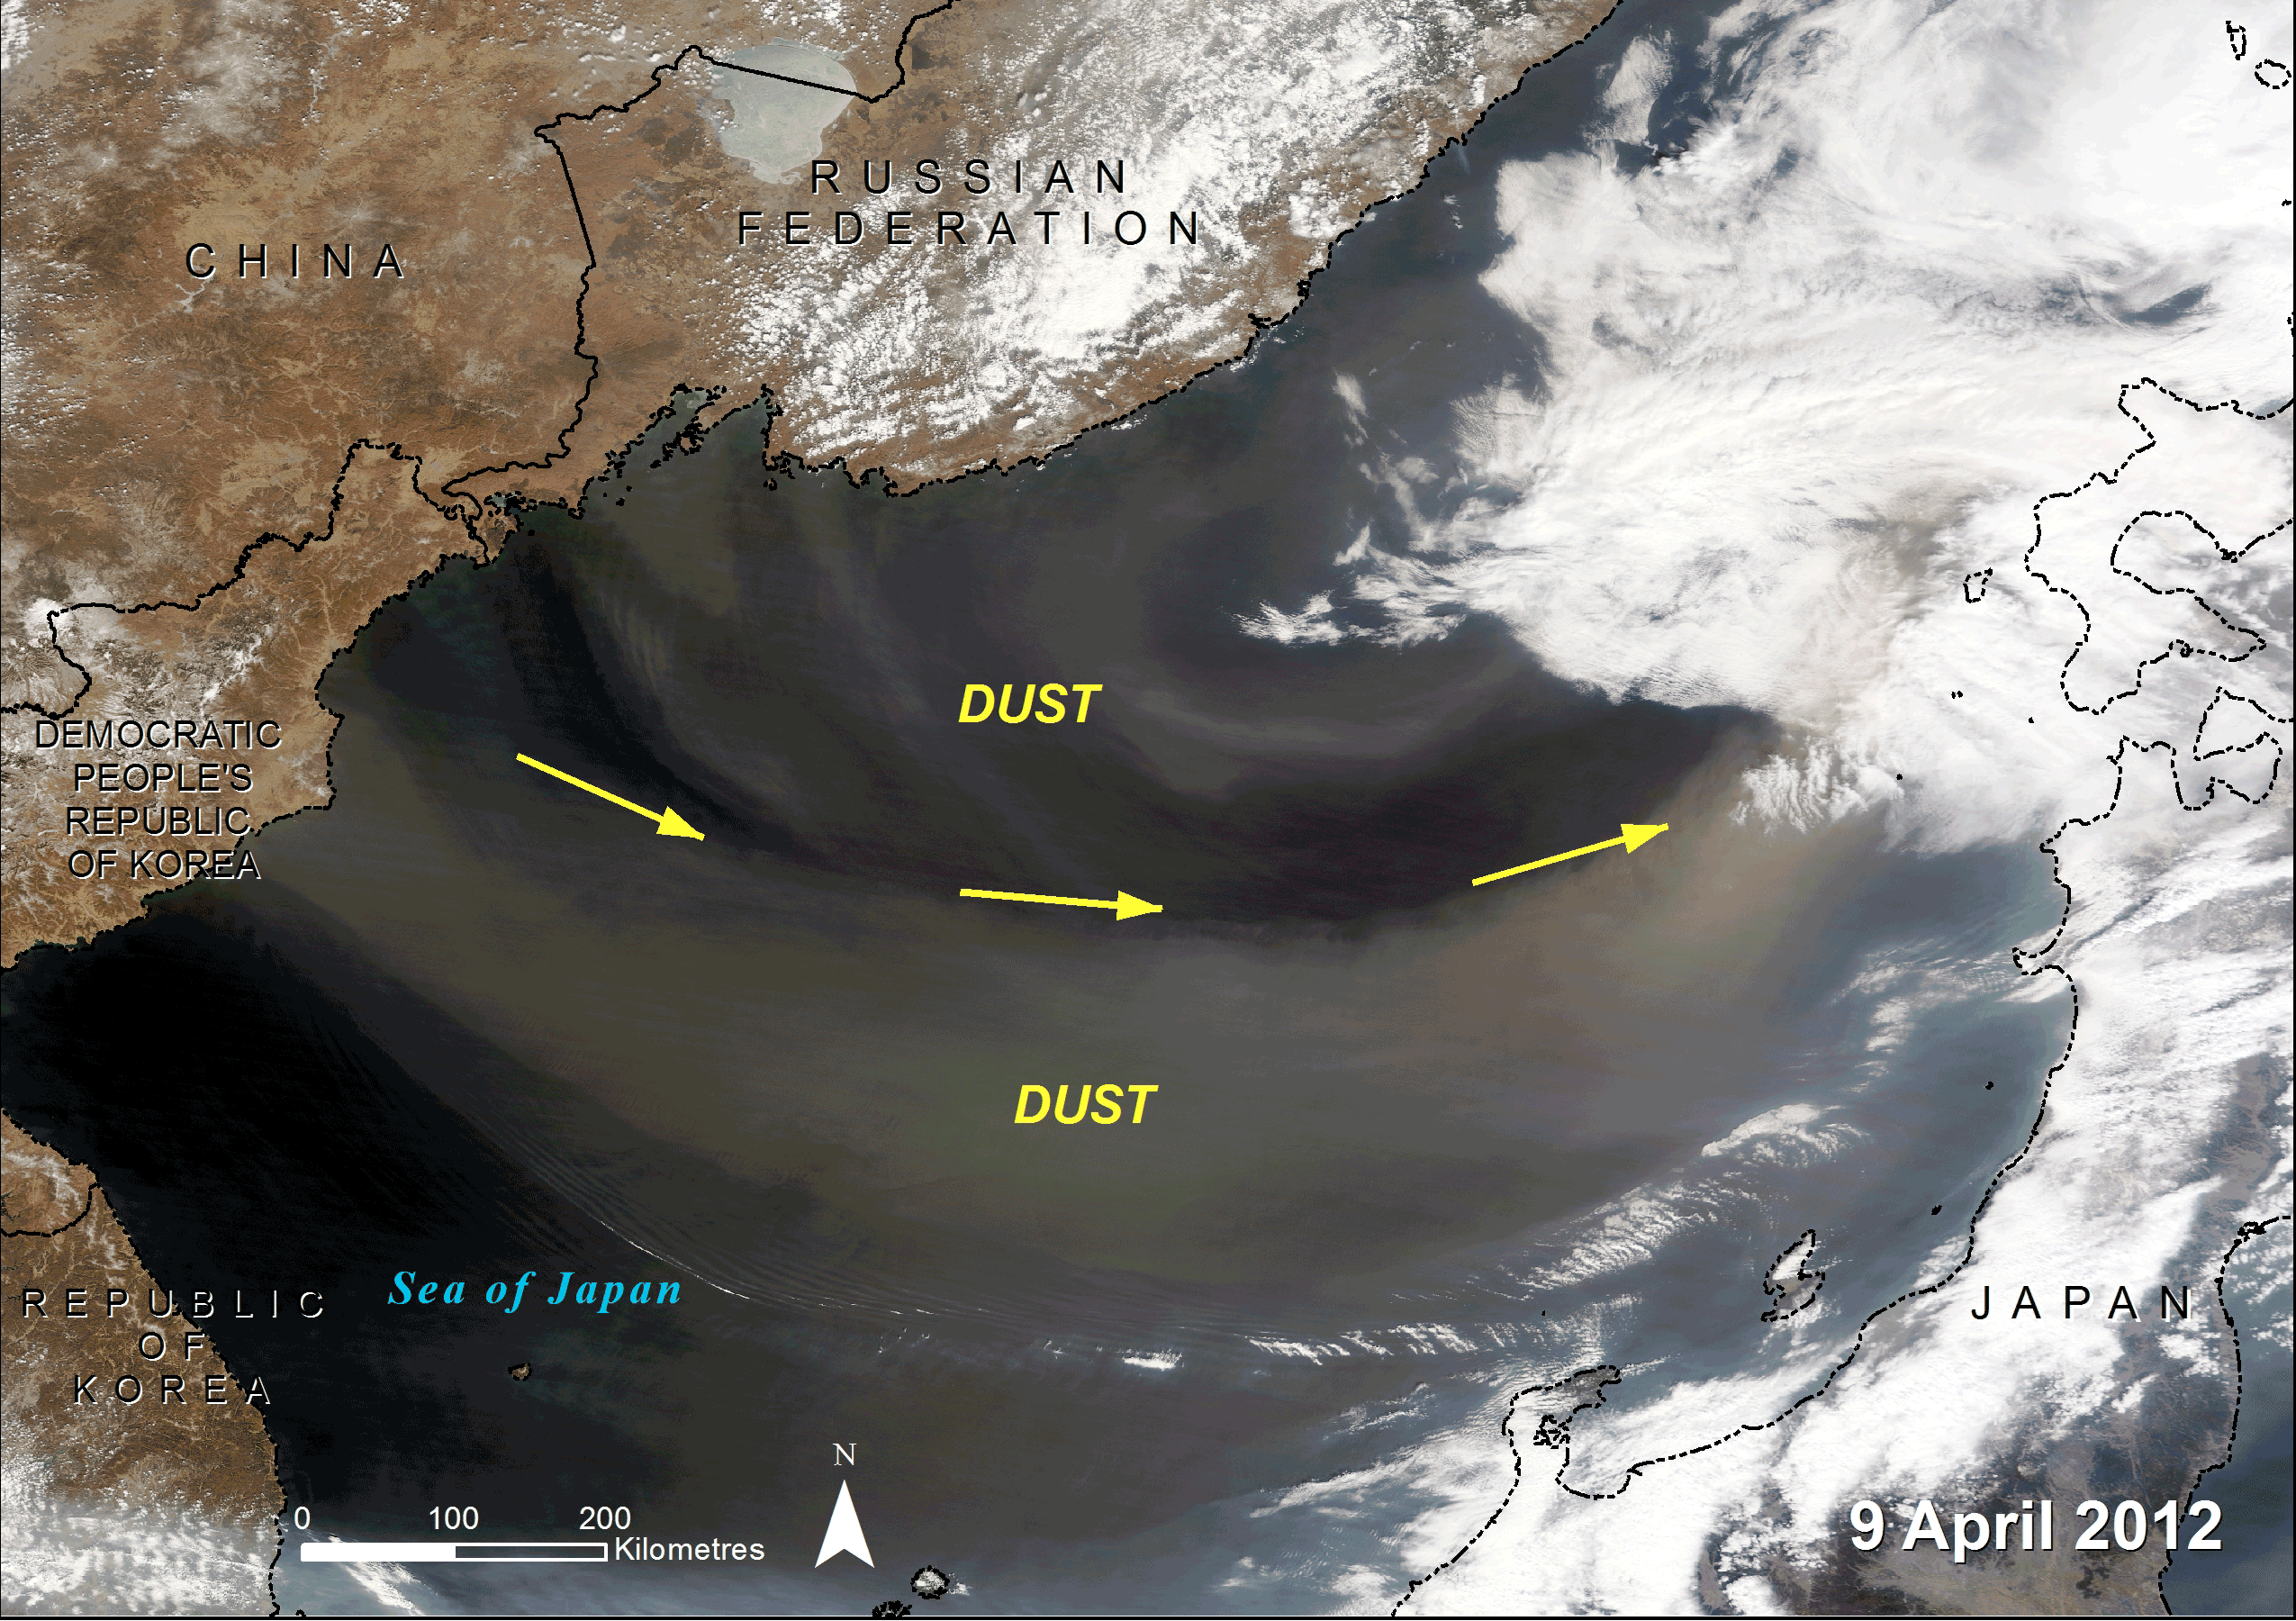
2012a; Kimura, 2012b; Onishi et al., 2012). Evidence of dust being carried over the Sea of Japan is presented in Figure 8.
Yellow sand dust storms create an array of problems for Japan such as decreased visibility, presence of soil-derived and anthropogenic
metals when transported with dust (Onishi et al., 2012), and decreased agricultural activity conducted in glass houses since dust
prevents adequate UV light from reaching crops and plants (Taylor, 2002; Kimura, 2012b). These storms have also been reportedly
responsible for worsened symptoms in asthmatics, heightened cases of respiratory issues and meningitis, instances of skin
irritation, and widespread distribution of fungi (Otani et al., 2011; Shi et al., 2005; Zhou et al., 2008).
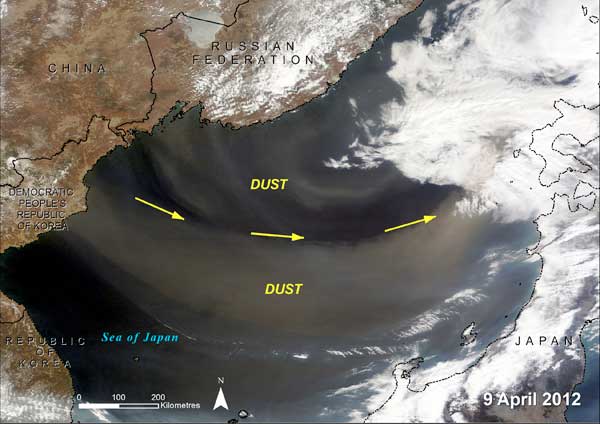
Figure 8. Fine yellow dust from Inner Mongolia blew over China, the Democratic
Peoples Republic of Korea, the Russian Federation, Japan and blanketed the Sea of Japan (NASA, 2012a). Image acquired on 9 April 2012 by
MODIS on NASAs Terra satellite (image courtesy Jeff Schmaltz (NASA, 2012a); visualisation by UNEP/GRID-Sioux Falls).
Full Size Image
What can be done?
Early warning systems create the opportunity to not only communicate a severe event, but also its anticipated impact, cost
of impact and the overall level of uncertainty. With early warning people could better prepare for a dust storm by taking
cover, sealing doors and windows, vacating the streets thus preventing car accidents and securing outdoor assets such as
vehicles and manufacturing equipment. Farmers would be able to bring in livestock, farm equipment and, depending on how
early the warning is provided, they could harvest all or a portion of a crop before the onset of a storm (Stefanski and
Sivakumar, 2009). In the long term, farmers can decide if preventative physical structures such as shelterbelts and
windbreaks would be beneficial for their farms.
A significant part of early warning is an accurate and thorough forecast. Forecasts enable scientists and others to observe how
dust storms are forming and moving over space and time. Policymakers can also use this information to determine whether or
not disease outbreaks were the result of transported sand and dust or the result of human transport when taking action against
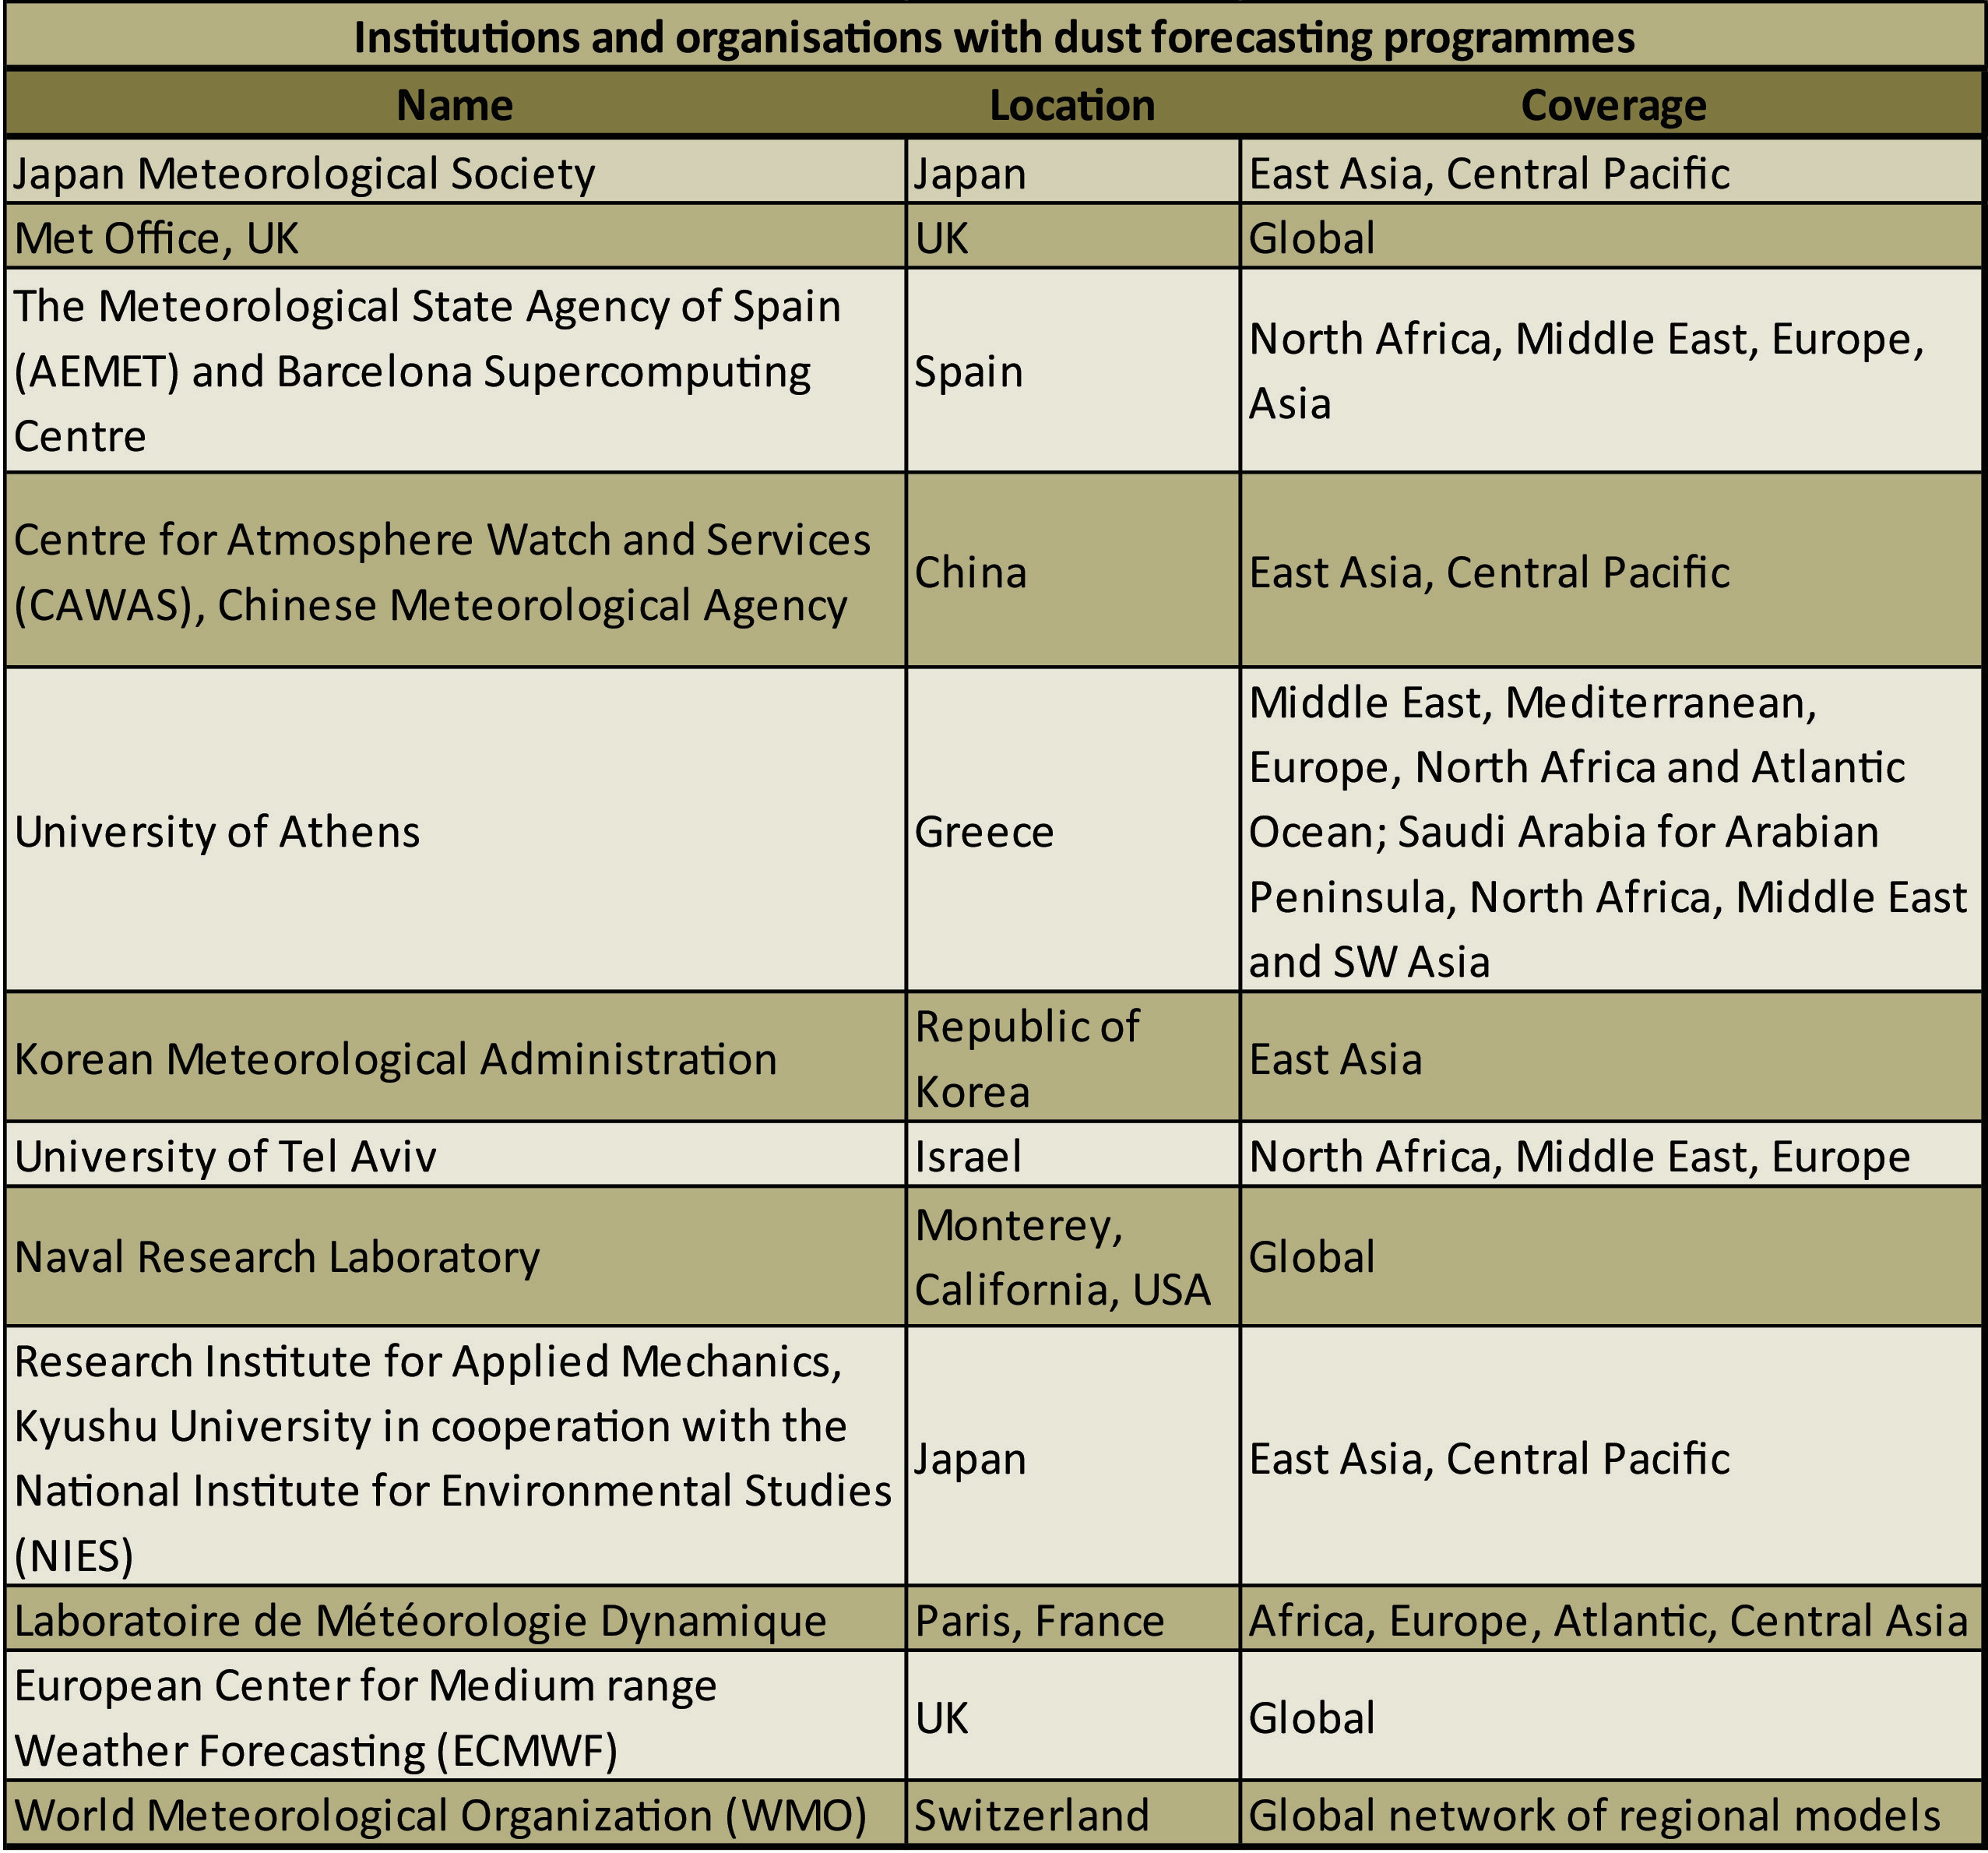
health risks (Stefanski and Sivakumar, 2009; UN, 2009). A sampling of institutions and organisations from around the world
that offer some forecast or warning support are listed in Table 2. Most of these organisations or institutions provide free
access to the forecasts via their websites, but others charge for access.
The use of forecasting networks
Due to the highly mobile nature of dust, global networks of forecasting systems are necessary to help predict the onset,
duration and path of a dust storm for the protection of both humans and the environment. Since 2007, the World Meteorological
Organisation (WMO) has operated a collaborative network of 15 organisations with several different forecasting models for
comparison and analysis called the Sand and Dust Storm Warning Advisory and Assessment System (SDS-WAS). Dust forecasting
resources are available for four regions divided into two nodes: one node for Africa, the Middle East, and Europe and
another node for Asia. The SDS-WAS has enabled WMO associated scientists and partner organisations to better understand
dust processes and develop a societal benefit of early warning for dust storms (WMO, n.d.). A collaborative network creates
a central resource location for scientists, the public and other interested parties.
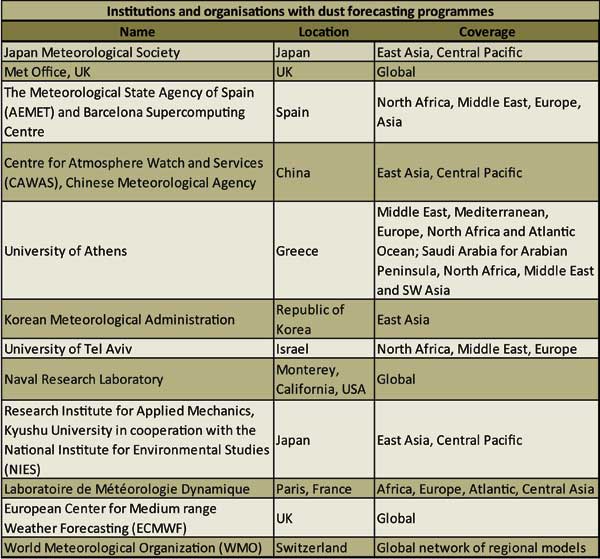
Table 2. Institutions and Organisations with Dust Forecasting Programmes (WMO, 2011).
Please note that this is not a comprehensive list. Find more information here:
http://www.wmo.int/pages/prog/arep/wwrp/new/documents/Organizations_delivering_SDS_forecasts.pdf.
Full Size Image
Regional forecasting model: CUACE/Dust
China has been monitoring dust storm events since the 1950's as a part of routine weather monitoring (Wang et al., 2008).
The CUACE/Dust (Chinese Unified Atmospheric Chemistry Environment for Dust) model is an integral part of a real-time mesoscale
sand and dust storm forecasting system for eastern Asia. The system is capable of producing 24-hour, 48-hour, and 72-hour
forecasts from the model. In addition to meteorological data and dust aerosol conditions, the CUACE/Dust model also incorporates
information about the distribution of deserts and semi-deserts, soil grain size, soil moisture content, snow cover, land use and
surface roughness length (Zhou et al., 2008). Identifying and analysing these factors allows scientists to make more educated
assumptions about how land will be affected if a dust storm were to occur. In addition, the aerosol module that is used with
CUACE/Dust can differentiate the size of suspended particles (Zhou et al., 2008). From this information analysts are able to
make inferences about transport distance; fine particles remain suspended in the atmosphere longer and can travel farther
than coarse particles. The CUACE/Dust model has been acknowledged as a suitable model for sand and dust storm events in
East Asia (Wang et al., 2008) and is included as forecast model in the Asia node of the WMO SDS-WAS.
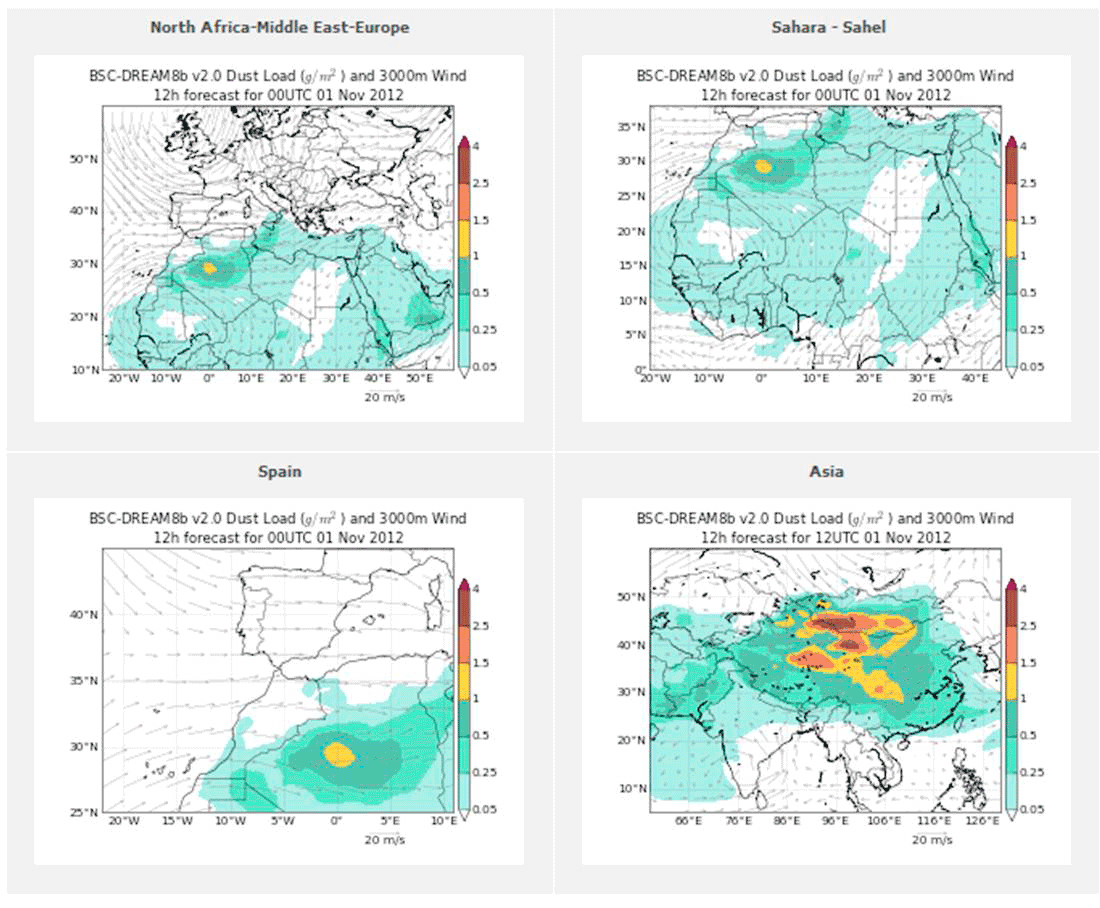
Global forecasting model: BSC-DREAM8b
Forecasting models with near global coverage such as the Barcelona Supercomputing CentreDust REgional Atmospheric
Model 8b v2.0 (BSC-DREAM8b) are able to provide forecasts of the atmospheric life cycle of dust particles
originating from deserts (BSC, 2012). This particular model has the ability to offer animated cycles of forecasts in
six hour intervals from real time to 72 hours in the future, for four substantial dust producing regions in the
world (Figure 9). Forecasts such as BSC-DREAM8b help to not only identify a storm in a local area, but also help
to project movement of the storm across large geographic expanses over a period of several days.
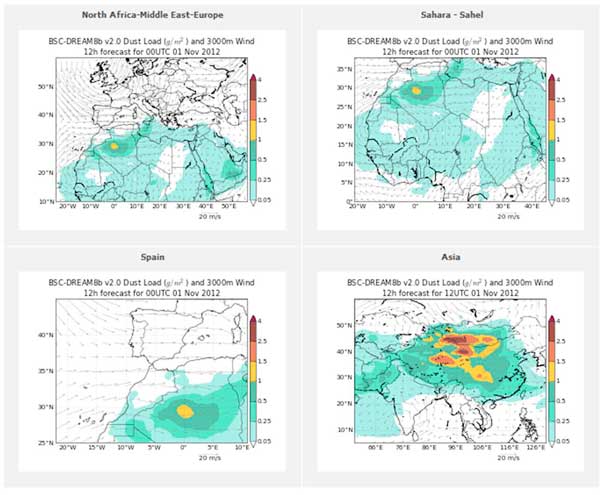
Figure 9. Sample November 1, 2012 12 hour dust load forecast for North Africa-Middle
East, Sahara-Sahel, Spain, and Asia (BSC 2012). Images from the BSC-DREAM8b (Dust REgional Atmospheric Model) model, operated by the Barcelona Supercomputing Center.
The images are a snapshot of an animation that cycles forecasts from 0h to 06h, 12h, 18h, 24h, 30h, 36h, 42h, 48h, 54h, 60h, 66h, and 72h.
Full Size Image
Early Warning Systems: how is the information delivered?
A forecast contributes to early warning, but can only provide a real warning if it is properly communicated.
As with most other severe weather or natural hazard events, dust storm warnings appear to be most widely provided
via national or regional weather services (Davidson et al., 2003), spreading the word through television, internet,
radio, and newspapers. Both the Korea Meteorological Administration (KMA) and the National Weather Service (NWS)
in the USA provide dust storm warning information to some cell phone providers which then communicate the information
to subscribers via text message (NEMA, 2006; NOAA, 2012). The KMA has provided text message alerts since at least
2006 and the USA just began this system in the summer of 2012 as a part of severe weather alert initiative. Although
a text message alert system may not work in every nation as the wireless network would have to be quite robust, it is
a good model for how to quickly distribute easy to understand information to a large population. Another example of an
early warning platform that updates frequently is a website hosted by the National Centre of Meteorology and Seismology
in the United Arab Emirates. The website updates warnings every three hours providing information about dust conditions
and visibility to the public and local media sources (NCMS, 2013). The website cautions citizens to be aware, prepared,
or to take action depending on the severity of the conditions. While early warning systems such as these exist, there
appears to be a lack of literature or research gauging the depth and effectiveness of such systems.
Where do we go from here?
Many studies report that continued research using meteorological data, satellite imagery, and remote sensing
information is needed to further examine the following aspects concerning dust storms and forecasting (Stefanski
and Sivakumar, 2009; Urban et al., 2009; Kimura, 2012b):
- Improve models and ground station monitoring to increase the accuracy of forecasts and length of available forecasts
- Determine and refine seasonal and climatic trends including implications of climate change
- Refine dust source areas by considering geomorphological characteristics of the land such as
topography, glacial presence and particle composition (Wang et al., 2008)
- Determine the effectiveness of re-vegetation projects in reducing the occurrence of a dust
storm (i.e. Grain to Green Program in China) (Kimura, 2012a)
- Increase quantity and geographical spread of air quality monitoring stations to improve the ability to
determine where a dust storm originates (Leys et al., 2011; Wang et al., 2008)
- Continue studies evaluating dust implications on health, especially in West Africa and the
Middle East where studies are scarce (de Longueville et al., 2013; Thalib and Al-Taiar, 2012)
In addition to continued and enhanced research, a mechanism for creating, supporting and operating successful early
warning systems is necessary to communicate research findings. While the current early warning networks and
systems have a wealth of information to provide, it may not be easily understood by a wide variety of audiences.
There is a demonstrated need in the following areas:
- Increased education and awareness to promote the information and forecasts that are publically and freely available
- Establishment of appropriate communication channels for the dissemination of interpreted dust forecasts at a
frequency that enables preparedness (i.e. through weather news networks, text message alerts)
- Development of policies and practices regarding land use, development, desertification and any
other risk increasing activity to attempt to mitigate the inception of a dust storm
- A metric for measuring and evaluating aid and risk reduction activities so future improvements can be made if warranted
In conclusion, as changes in land cover and the global climate continue to occur, early detection and warning of dust storms in
conjunction with effective and widespread information broadcasts will be essential to the prevention and mitigation of future risks and impacts.
Acknowledgement
Written by: Lindsey Harrimana.
Reviewed by: Arshia Chandera, Ron Wittb, Ashbindu Singha,c, Neeyati Patelc, Theuri Mwangic, Zinta Zommersc
Production and Outreach Team: Arshia Chandera, Lindsey Harrimana, Erick Litswac, Kim Giesea, Michelle Anthonya, Reza Hussaina, Theuri Mwangic, and Zinta Zommersc
Special thanks to Juanle Wangd, Ali Al-Dousarie, Ritesh Gautamf, and Ramesh Singhg for comments and reference suggestions
(a UNEP/GRID-Sioux Falls, b UNEP/GRID-Geneva, c UNEP/DEWA/Nairobi, d Institute of Geographic Sciences and Natural Resources Research, CAS,
e Kuwait Institute for Scientific Research, f NASA/Goddard Space Flight Center, g Chapman University)
References
Al-Dousari, A., Al-Awadhi, J., 2012. Dust fallout characteristics within global dust storms major trajectories.
Arabian Journal of Geosciences, doi:10.1007/s1257-012-0644-0.
BSC, 2012. BSC-DREAM8b v2.0 Atmospheric Dust Forecast System. Barcelona Supercomputing Center Earth Sciences.
http://www.bsc.es/projects/earthscience/BSC-DREAM/ (accessed 01.11.12).
Dagvadorj, D., Natsagdorj, L., Dorjpurev, J., Namkhainyam, B., Gomboluudev, P., Batimaa, P., Jugder, D., Mijiddorj,
R., Davaa, G., Erdenetsetseg, B., Khaulenbek, 2009. Climate Change Observation and Research in Mongolia, in: D. Dagvadorj,
B. Khuldorj, R. Aldover (Eds.), Mongolia Assessment Report on Climate Change 2009. Ministry of Environment,
Nature and Tourism, Mongolia, Ulaanbaatar, pp. 32 57.
Davidson, J., Lam, H., Lam, C.Y., Wass, S., Dupuy, C., Chavaux, F., 2003. Guidelines on Cross-Border Exachange of
Warnings, H. Kootval (Ed.). World Meteorological Organization, Available at:
http://www.wmo.int/pages/prog/amp/pwsp/pdf/TD-1179.pdf (accessed 31.01.13).
de Longueville, F., Ozer, P., Doumbia, S., Henry, S., 2013. Desert dust impacts on human health: An alarming worldwide
reality and a need for studies in West Africa. International Journal of Biometeorology 57(1), 1 19.
Du, M., Seiichiro, Y., Shen, Z., Shen, Y., Wang, W., and Maki, T., 2002. Wind Erosion Processes during Dust Storm in
Dunhuang, China. In the Editorial Committee (Ed.d), Proceedings 12th International Soil Conservation Organization Conference
Dynamic Monitoring, Forecasting and Evaluation of Soil Erosion Watershed Management and Development Desertification
Control. Tsinghua University, China, pp. 624 629.
Ganor, E. Osetinksy, I., Stupp, A., Pinhas, A., 2010. Increasing trend of African dust, over 49 years, in the eastern
Mediterranean. Journal of Geophysical Research: Atmospheres, 115, D07201, doi:10.1029/2009JD012500.
Gautam, R., Hsu, N.C., Lau, K-M., 2010. Premonsoon aerosol characterization and radiative effects over the
Indo-Gangetic Plains: Implications for regional climate warming. Journal of Geophysical Research. 115, D17208.
Goudie, A. S., 2009. Dust storms: Recent Developments. Journal of Environmental Management. 90, 89 94.
Kimura, R., 2012a. Effect of the Strong Wind and Land Cover in Dust Source Regions on the Asian Dust Event over
Japan from 2000 to 2011. Scientific Online Letters on the Atmosphere. 8, 77 80.
Kimura, R., 2012b. Factors contributing to dust storms in source regions producing the yellow-sand phenomena
observed in Japan from 1993 to 2002. Journal of Arid Environments. 80, 40 44.
Lee, H., Liu, C., 2004. Coping with Dust Storm Events: Information, Impacts, and Policymaking in Taiwan. TAO, 15(5).
Leys, J., Heidenreich, S.K., Strong, C.L., McTainsh, G.H., Quigley, S., 2011. PM10 concentrations and mass
transport during Red Dawn Sydney 23 September 2009. Aeolian Research. 3, 327 342.
Marx, S.K., McGowan, H.A., Balz, K.S., 2009. Long-range dust transport from eastern Australia: A proxy for
Holocene aridity and ENSO-type climate variability. Earth and Planetary Science Letters. 282, 167 177.
Met Office, 2012. Dust storm brings Saharan sand to the UK. Met Office News Blog. 28 June 2012.
http://metofficenews.wordpress.com/2012/06/28/dust-storm-brings-saharan-sand-to-the-uk/ (accessed 25.01.13).
NASA, n.d. OMI Ozone Monitoring Instrument. National Aeronautics and Space Administration.
http://aura.gsfc.nasa.gov/instruments/omi.html (accessed 31.01.13).
NASA, 2012a. Dust over the Sea of Japan. NASA Earth Observatory.
http://earthobservatory.nasa.gov/NaturalHazards/view.php?id=77665 (accessed 22.10.12).
NASA, 2012b. OMI Aerosol Images 2012. National Aeronautics and Space Administration.
http://ozoneaq.gsfc.nasa.gov/datadis.md?year=2012&instr=omi&prod=aerosol&patt=IM_aersl_omi (accessed 24.10.12).
NCDC/NOAA, 2012. Storm Events Database. National Oceanic and Atmospheric Administration National
Climatic Data Center.
http://www.ncdc.noaa.gov/stormevents/ (accessed 04.02.13).
NCMS, 2013. Warnings. National Centre of Meteorology and Seismology.
http://www.ncms.ae/warning/warning3.htm (accessed 31.01.13).
NEMA, 2006. International cooperation key to combating dust storms. National Emergency Management Agency News.
22 April 2006.
http://eng.nema.go.kr/sub/cms5/view.asp?c_no=75&c_step=0&c_relation=2&c_relation2=1&page=5 (accessed 05.02.13).
NOAA, 2012. Mobile weather warnings on the way! National Oceanic and Atmospheric Administration.
http://www.noaa.gov/features/03_protecting/wireless_emergency_alerts.html (accessed 31.01.13).
NRL, 2009. Description of NAAPS (Navy Aerosol Analysis and Prediction System) Global Aerosol Model.
Naval Research Laboratory.
http://www.nrlmry.navy.mil/aerosol/Docs/globaer_model.html (accessed 24.10.12).
Onishi, K., Kurosaki, Y., Otani, S., Yoshida, A., Sugimoto, N., Kurozawa, Y., 2012. Atmospheric
transport route determines components of Asian dust and health effects in Japan. Atmospheric Environment. 49, 94 102.
Otani, S., Onishi, K., Mu, H., Kurozawa, Y., 2011. The effect of Asian dust events on the daily
symptoms in Yonago, Japan: A pilot study on healthy subjects. Archives of Environmental and Occupational Health 66(1), 43 46.
Scott, M., 2012. Dust Storm over Iraq. NASA Earth Observatory.
http://earthobservatory.nasa.gov/NaturalHazards/view.php?id=78087 (accessed 24.01.13).
Shi, P.J., Shimizu, H., Wang, J.A., Liu, L. Y., Li, X.Y., Fan, Y.D., Yu, Y.J., Jia, H.K., Zhao, Y.,
Wang, L., and Song, Y., 2005. Land degradation and blown-sand disaster in China, in: K. Omasa, I. Nouchi,
and L.J. De Kok (Eds.), Plant Responses to Air Pollution and Global Change. Springer-Verlag, Tokyo, pp. 261-269.
Sivakumar, M.V.K., 2005. Impacts of Sand/Dust Storms on Agriculture, in: M.V.K. Sivakumar, R.P. Motha, and
H.P. Das (Eds.), Natural Disasters and Extreme Events in Agriculture. Springer-Verlag, Berlin, pp. 150-177.
Steenburgh, W.J., Massey, J.D., Painter, T., 2012. Episodic Dust Events of Utah's Wasatch Front and Adjoining Region.
Journal of Applied Meteorology and Climatology 5(9), 1654-1669.
Stefanski, R and Sivakumar, M.V.K., 2009. Impacts of Sand and Dust Storms on Agriculture and Potential Agricultural
Applications of a SDSWS. IOP Conference Series: Earth and Environmental Science. 7, 012016.
Taylor, D., 2002. Dust in the Wind. Environmental Health Perspectives 110(2), A80-A87.
Thalib, L. and Al-Taiar, A., 2012. Dust storms and the risk of asthma admissions to hospitals in Kuwait.
Science of the Total Environment. 433, 347 351.
UCAR/COMET, 2010. Atmospheric Dust. The COMET Program and University Corporation for Atmospheric Research
sponsored in part through cooperative agreement(s) with the National Oceanic and Atmospheric Administration
(NOAA), U.S. Department of Commerce (DOC). ©1997-2011 University Corporation for Atmospheric Research.
All Rights Reserved."
https://www.meted.ucar.edu/training_module.php?id=820 (accessed 17.10.12).
UN, 2009. UN experts call for early warning system to deal with rising number of sand, dust storms.
United Nations News Centre. 25 September 2009.
http://www.un.org/apps/news/story.asp?NewsID=32255&Cr=&Cr1 (accessed 26.10.12).
Urban, F.E., Reynolds, R.L., Fulton, R., 2009. The Dynamic Interaction of Climate, Vegetation, and
Dust Emission, Mojave Desert, USA, in: A. Fernandez-Bernal and M.A. De La Rosa (Eds.), Arid Environments
and Wind Erosion. Nova Science Publishers, Inc., New York. pp. 1 25.
Wang, X., Xia, D., Wang, T., Xue, X., Li, J., 2008. Dust sources in arid and semiarid China and Southern
Mongolia: Impacts of geomorphological setting and surface materials. Geomorphology. 97, 583 600.
Washington, R., Todd, M., Middleton, N. J., Goudie, A. S., 2003. Dust-Storm Source Areas Determined by the
Total Ozone Monitoring Spectrometer and Surface Observations. Annals of the Association of American Geographers 93(2), 297 313.
Wilcox, B., 2012. Dust Storms Roll Across America. United States Geological Survey Science Features.
http://www.usgs.gov/blogs/features/usgs_top_story/dust-storms-roll-across-arizona-2/ (accessed 17.10.12).
WMO, 2011. Organizations delivering SDS forecasts. World Meteorology Organization.
http://www.wmo.int/pages/prog/arep/wwrp/new/documents/Organizations_delivering_SDS_forecasts.pdf (accessed 24.10.12).
WMO, n.d. Sand and Dust Storm Warning Advisory and Assessment System. World Meteorology
Organization.
http://www.wmo.int/pages/prog/arep/wwrp/new/Sand_and_Dust_Storm.html. (accessed 17.10.12).
Zhou, C. H., Gong, S. L., Zhang, X. Y., Wang, Y. Q., Niu, T., Liu, H. L., Zhao, T. L., Yang, Y. Q.,
and Hou, Q., 2008. Development and evaluation of an operation SDS forecasting system for
East Asia: CUACE/Dust. Atmospheric Chemistry and Physics. 8, 787-798.
If you no longer wish to receive this bulletin you can unsubscribe anytime.
Information is regularly scanned, screened, filtered, carefully edited, and published for educational purposes. UNEP does not accept any liability
or responsibility for the accuracy, completeness, or any other quality of information and data published or linked to the site. Please read our
privacy policy and
disclaimer for further information.
|


