|
Having trouble reading this email?
View it on your browser or download the PDF.

Thematic Focus: Environmental Governance
Keeping Track of Our Changing EnvironmentFrom Rio to Rio +20 (1992-2012)

In 1992, the first United Nations Conference on Sustainable Development, popularly known as the Rio Earth Summit, was convened in
Rio de Janeiro, Brazil to address the state of the environment and sustainable development. The Earth Summit yielded several important agreements
including "Agenda 21", a plan of action adopted by over 178 governments to address human impacts on the environment at local, national and global
levels, and key treaties on climate change, desertification and biodiversity. At the second Conference in 2002the World Summit on Sustainable
Developmentgovernments agreed on the Johannesburg Plan of Implementation, reaffirming their commitment to Agenda 21. In 2012, the United Nations
Conference on Sustainable Development, or Rio+20 Earth Summit, will focus on the Green Economy in the context of sustainable development, poverty
eradication, and the institutional framework for sustainable development. The object is to renew political commitment to sustainable development,
review progress and identify implementation gaps, and address new and emerging challenges.
Why is this issue important?
This article, and a related publication called "Keeping Track of Our Changing Environment" (UNEP 2011), serve as a timely update on what
has occurred since the Earth Summit of 1992 and are part of the wider Global Environment Outlook-5 (GEO-5) preparations leading up to the release
of the landmark GEO-5 report in June 2012. It underlines how in just twenty years, the world has changed more than most of us could ever have imaginedgeopolitically,
economically, socially and environmentally. Very few individuals outside academic and research communities envisaged the rapid pace of change or foresaw
developments such as the phenomenal growth in information and communication technologies, ever-accelerating globalisation, private sector investments across
the world and the rapid economic rise of a number of "developing" countries. Many rapid changes have also taken place in our environment, from the accumulating
evidence of climate change and its very visible impacts on our planet, to biodiversity loss and species extinctions, further degradation of land surfaces and the
deteriorating quality of oceans. Certainly, there have been some improvements in the environmental realm, such as the significant reduction in ozone-depleting
chemicals and the emergence of renewable energy sources, for which new investments totaled more than $200 thousand million in 2010. But in too many areas,
the environmental "dials" continue to head into the red.
Overall demographic and economic situation
In the past two decades, the number of people living on the planet increased by 26%, exceeding (end of October 2011) 7 000 million. A positive,
although in the short-term not directly remarkable aspect is that the population growth rate is slowly declining, dropping from 1.65% in 1992 to 1.2%
in 2010, which represents a 27% decline in the growth rate over that period. One general trend in the population distribution is clearly visible: the urban
population is increasing steadily, growing from 2 400 million people (43% of total population) to 3 400 million (50%) in 2009, an increase of 45%. This
trend in urbanization is expressed by the 110% increase of "megacities"x (cities with at least 10 million people), from 10 in 1992 to 21 in 2010. These growth
rates have brought new and emerging social, economic and environmental challenges. Although the share of the urban population living in slums in the developing
world has dropped from 46% to 33% as a result of improved housing and sanitation, the absolute number of slum-dwellers has increased by 171 million
people, raising their number to 827 million in 2010.
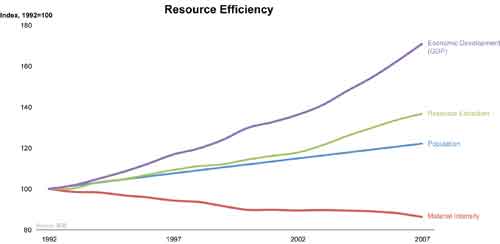
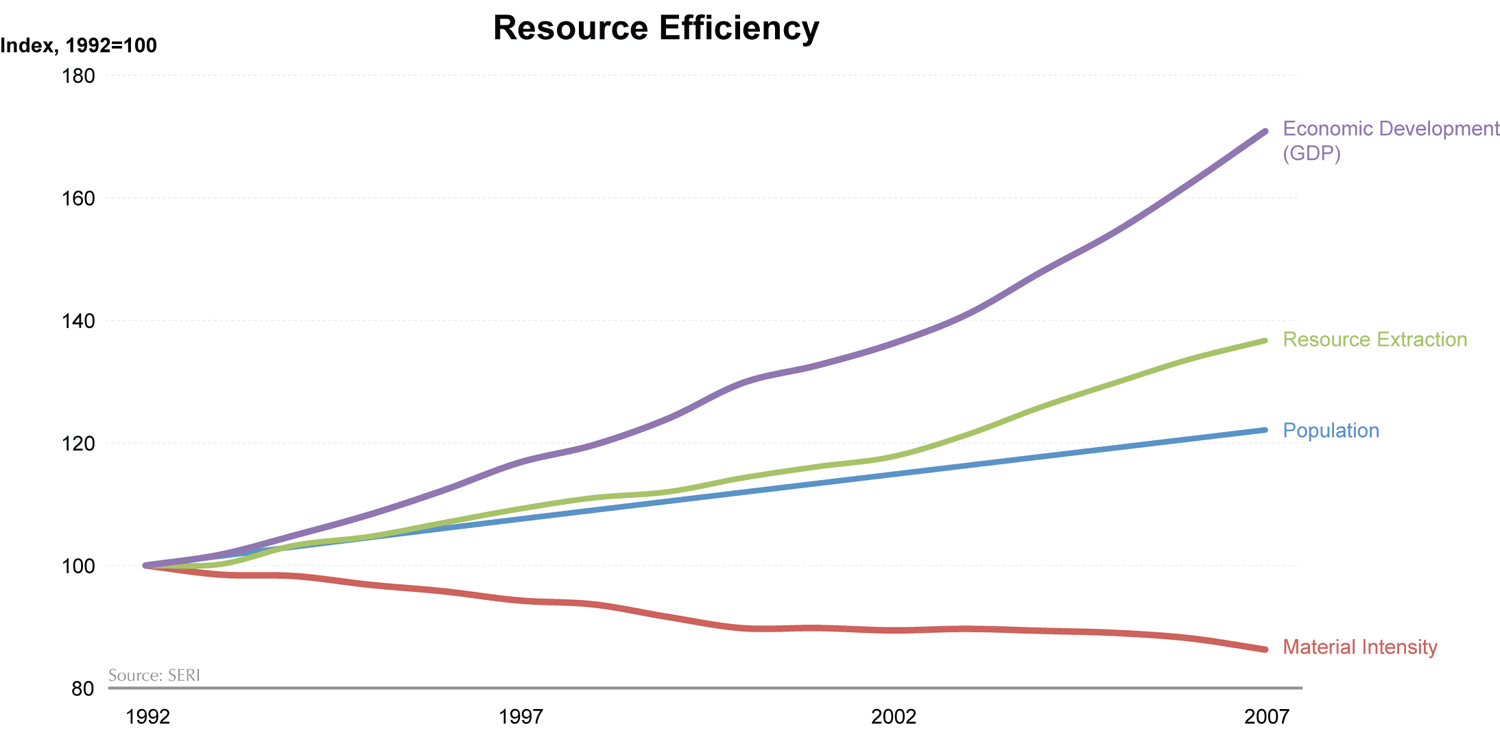
Figure 1: More energy and natural resources are being consumed, but the amounts needed per product are declining
Full Size Image
While total GDP grew by 75% and per capita GDP by 40%, there are evidently large regional and national differences (seven-fold between "developed" and
"developing" regions), although growth rates were much higher in the last 10 years in developing countries than in the developed ones. At the same
time, international trade has increased between 1992 and 2008 from US$ 9 to 36 million millions (an increase of 280%), before falling a bit in the aftermath
of the economic crisis. As societies grow and become wealthier, demand for basic materials (minerals, fossil fuels, biomass) grew by over 40% between 1992 and
2005, from about 42 to nearly 60 thousand million tonnes. Nonetheless, there is a simultaneous decline in emissions, energy and material use per unit of output,
indicating that resource efficiency is slowly increasing. At the same time, source and effect of the economic growth is a growing electricity production,
increasing by 66% between 1992 and 2008, with developing countries showing more than three times larger growth rates (68%) than developed countries.
The (mostly) bad news
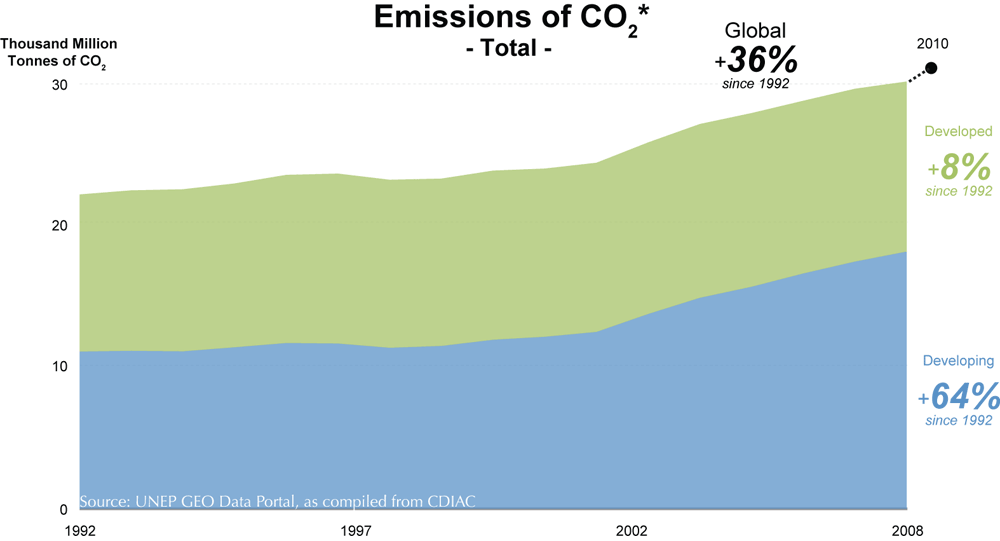
With fossil fuels taking up over 80% of the total primary energy supply and their use rising by almost 40% between 1992 and 2009, emissions
of CO2 increased by 38%, reaching 36 000 million tonnes in 2010. Although developing countries, through their general economic growth and many
large-scale development projects, had the highest growth rates (64%), the difference of per capita emissions between developing and developed countries is
still nearly a factor of 10. The steadily increasing amount of fossil fuels burned for generating energy and heating (26% of global anthropogenic GHG emissions,
2004), industry (19%), agriculture (14%), transport (13%) and other uses, leads to an increasing concentration of atmospheric CO2, which rose from 357
parts per million in 1992 to 389 early 2011, an increase of 9% (IPCC 2007). At the same time, global temperatures show a slow, but steady increase of
about 0.2°C per decade (Hansen and others 2006).
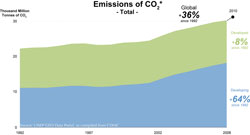
Figure 2: Global CO2 emissions continue to rise, with 80% emitted by only 19 countries
(* from fossil fuels, gas flaring, cement production, asprovided through the original source)
Full Size Image
|
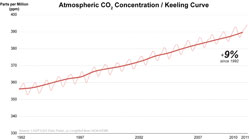
Figure 3: The average amount of CO2 in the Earth's atmosphere shows a steady rise over the last two decades
Full Size Image
|
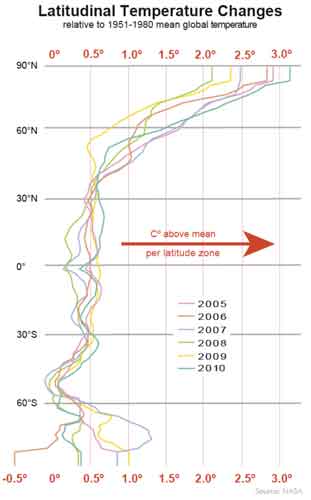
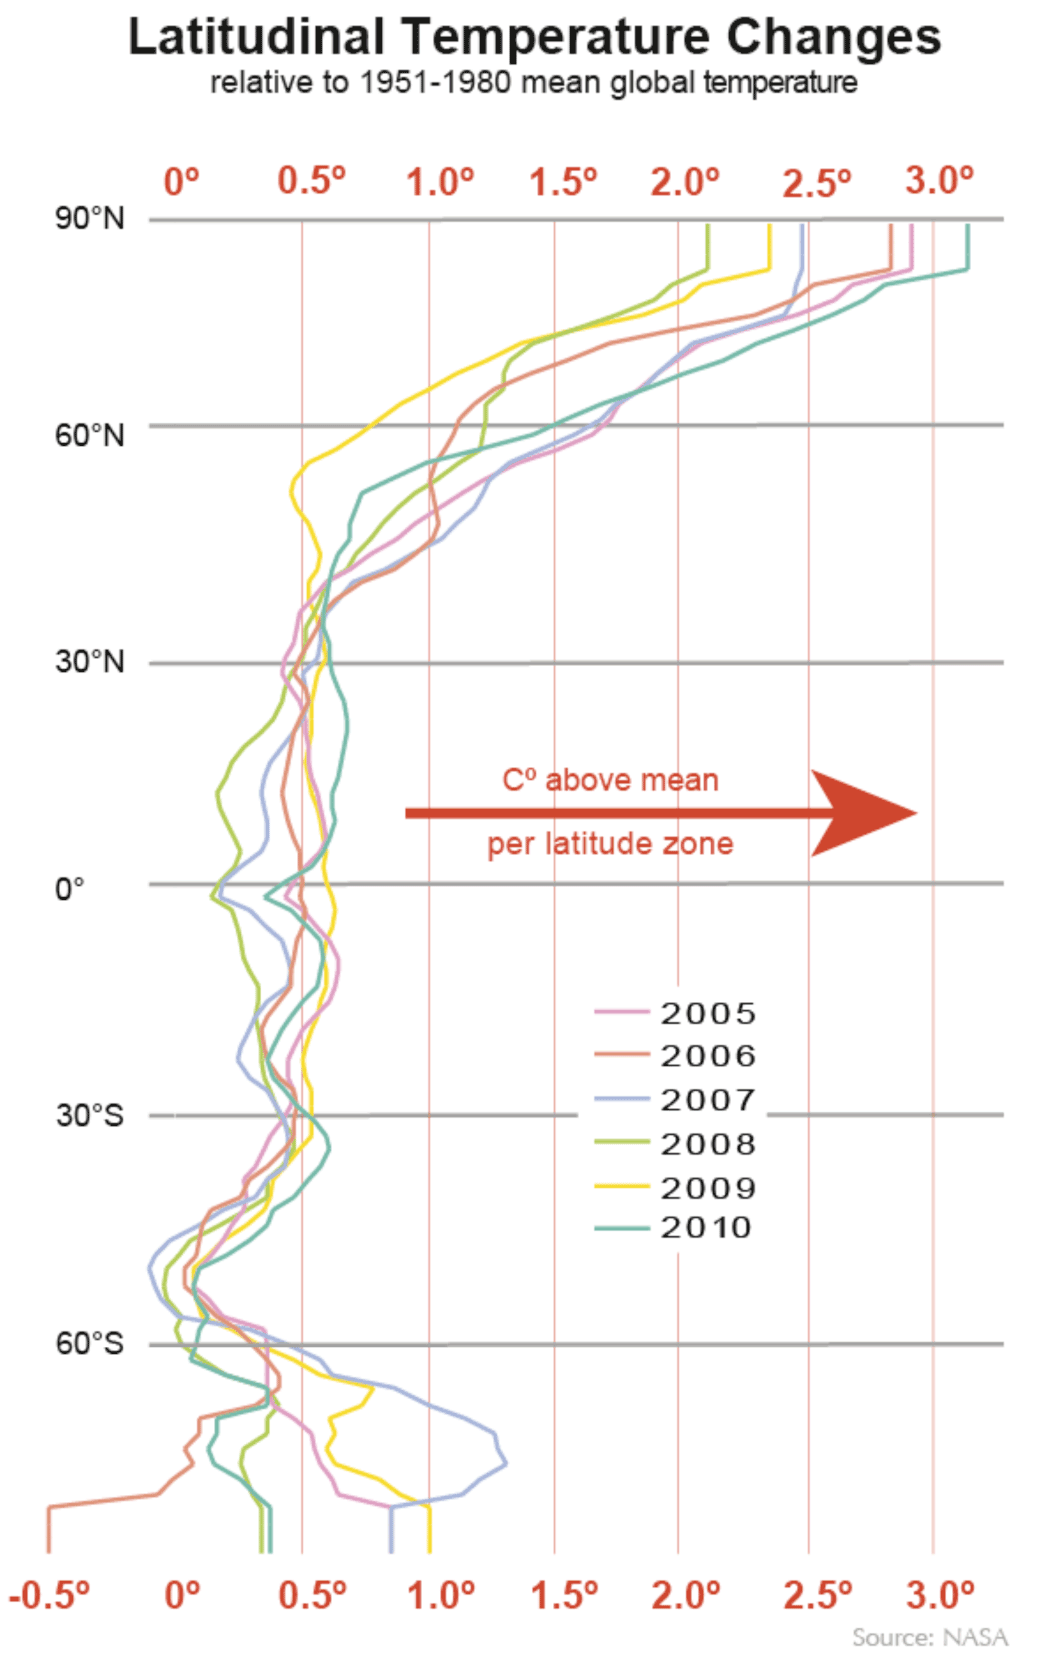
Figure 4: Far northern latitudes are seeing the most extreme changes in temperature
Full Size Image
|
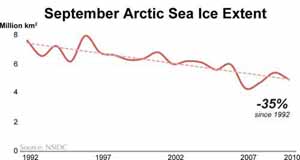
Figure 5: The annual minimum extent of Arctic sea ice continues its steady
Full Size Image
|
According to rankings from four top US, British and Japanese climate research centers, the ten hottest years on record have all occurred since
1998; and 18 out of the last 21 years feature among the 20 warmest years on record since (reliable) recording of temperature started in 1880
(NOAA 2011, NASA 2011, UK-MetOffice 2011, JMA 2011). As a consequence, nearly all mountain glaciers around the world are retreating and getting thinner
(WGMS 2010). But increase in global temperature is not occurring uniformly across the globes latitudinal zones: far northern latitudes are seeing the
most extreme changes in temperature, with increases of up to 3°C, while most of the other latitudes show variations around 0.5°. This impacts the Arctic
sea ice extent, which has been steadily declining: its September extent decreased from almost eight to around five million square kilometers between
1992 and 2010, a drop of 35%. Similar to the global atmospheric temperature, the average ocean temperatures are slowly increasing too, rising from 0.22°C
above the long-term average in 1992 to nearly 0.5°C in 2010. Due to this rising sea-water temperature and resulting thermal expansion, as well as the
melting of ice of the Arctic, Antarctic and Greenland ice sheets, the sea level has been rising globally at an average rate of about 2.5 mm per year between
1992 and 2011 (Bindoff and others 2007). Increasing carbon dioxide concentrations in the air alter the chemistry of the oceans surface, causing it to become
more acidic (measured by the logarithmic pH) (Caldeira and Wickelt 2003). The oceans pH declined from 8.11 in 1992 to 8.06 in 2007 (Feely and others 2009),
having potentially significant consequences for marine organisms (UNEP 2010).
Although the rate of deforestation is slowing down, natural forests declined, especially in South America and Africa, by around 13 million hectares per
year between 2000 and 2010, compared to 16 million hectares per year during the preceding decade (FAO 2010). This not only results in biodiversity loss,
but also contributes 12-15% to global warming (van der Werf and others 2009, UCSUSA 2011). Forest plantations, especially in Asia and to a lesser extent in
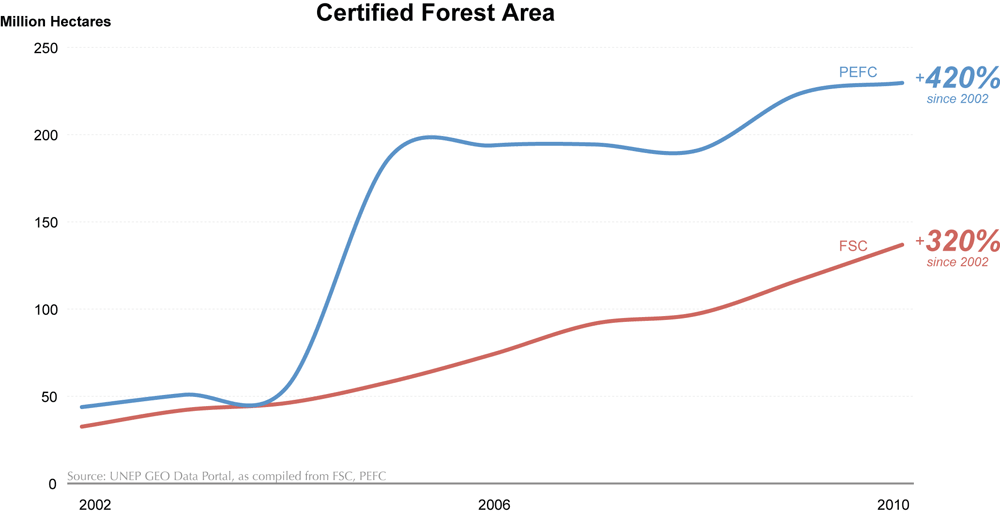
Europe, have seen an increase of 54% since 1990, covering 265 million hectares in 2010. Although certification for socially and environmentally responsible
forestry shows an impressive annual 20% growth rate, only about 10% of forests worldwide were managed under the two biggest labels (FSC, PEFC).
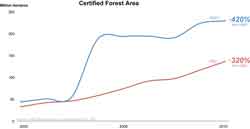
Figure 6: Only about 10% of global forests are under certified sustainable management
Full Size Image
|
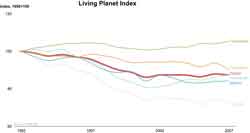
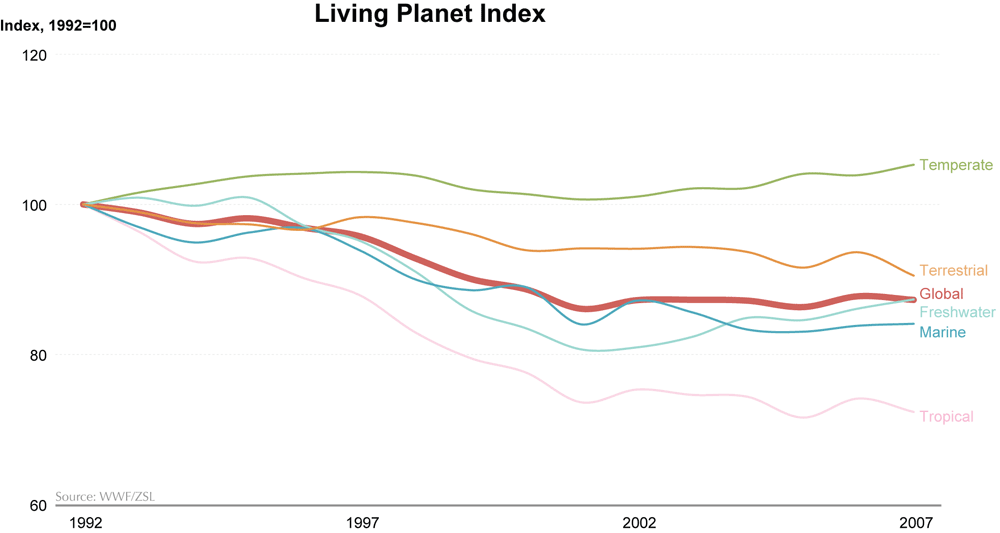
Figure 7: The Living Planet Index has declined by 12% at the global level and by 30% in the tropics
Full Size Image
|
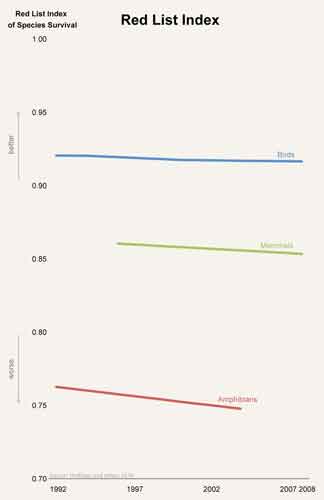
Figure 8: Each year 52 vertebrate species move one Red List category closer to extinction
Full Size Image
|
With disappearing forests, industrial agriculture and sprawling urbanization, the health of the earths ecosystems is decreasing. The Living Planet Index,
which monitors almost 8 000 populations of over 2 500 vertebrate species, shows the most extreme decline - by 30% - in the tropical biome, and drops between
10-15% for marine and freshwater biomes, as well as in the global average. This decrease is mirrored in the Red List Index, which measures the risk of
extinction, and which shows general deterioration for birds, mammals and amphibians; each year 52 vertebrate species move on Red List category closer
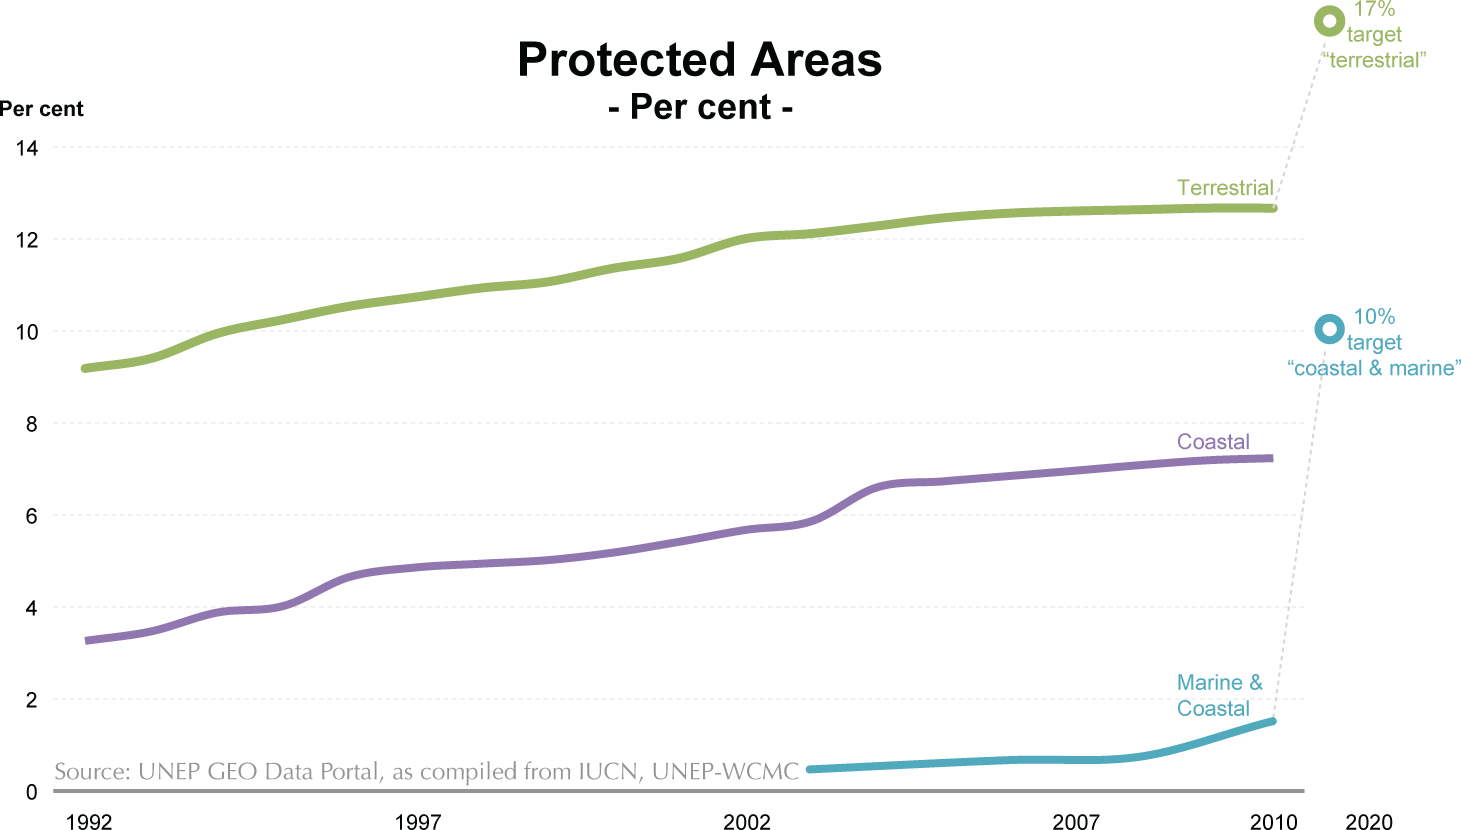
to extinction. In order to halt the constant loss of species and to protect biologically important zones, the total sum of protected land areas increased
by 42%, covering 13% of the continents. Marine protected areas, however, cover only around 7% of coastal waters and just above 1.4% of the oceans
(IUCN/UNEP 2011, Toropova and others 2010).
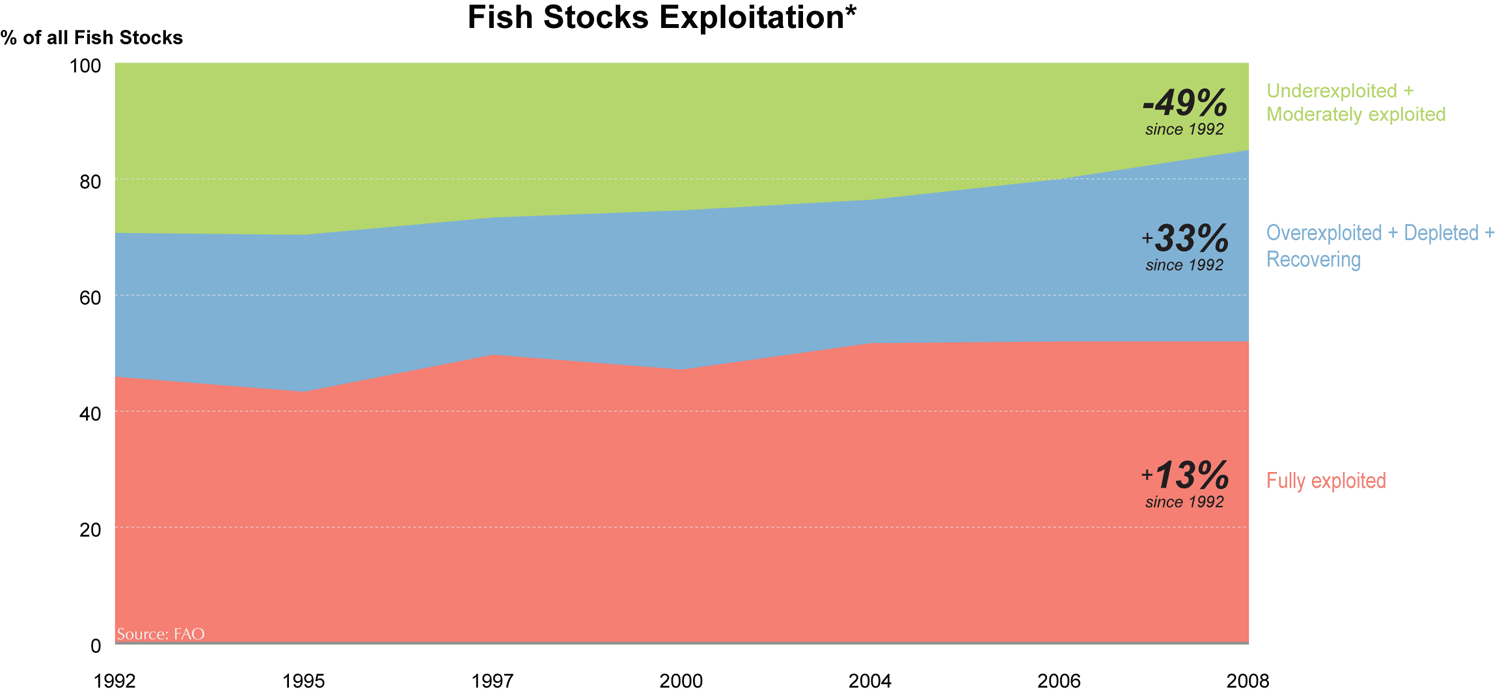
Since 1992, the proportion of fully-exploited fish stocks increased by 13% and overexploited, depleted or recovering stocks increased by 33%, reaching
52% and 33%, respectively, of all fish stocks. Only a small percentage of stocks, around 15%, are under-exploited or moderately exploited; these stocks,
however, saw a strong decrease of nearly 50% since 1992. This degradation nonetheless was accompanied by a slight decrease in marine fish catch. But with
catches of around 80 million tonnes for marine fish and 10 million tonnes (with a steady growth, 66% between 1992 and 2009) for inland water fish, the
pressure on water ecosystems remains high (UNEP 2011b). Tuna, for example, is an economically important, globally-traded fish that is increasingly in
demand by consumers. Catches increased dramatically, reaching 4200 thousand tonnes in 2008, an increase of 35%, leaving some tuna species on the
edge of extinction (IUCN 2011, Collette and others 2011).
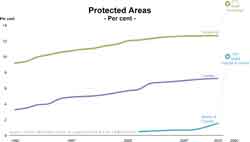
Figure 9: 13% of the world's land surface, 7% of its coastal waters and 1.4% of its oceans are protected
Full Size Image
|
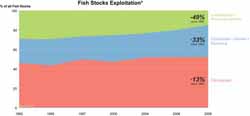
Figure 10: The depletion of fish stocks is one of the most pressing environmental issue
(* Underexploited or moderately exploited = able to produce more than their current catches; overexploited, depleted or recovering from depletion = yielding less than
their maximum potential production owing to excess fishing pressure in the past, with a need for rebuilding plans; fully exploited = current catches are at or
close to their maximum sustainable productions, with no room for further expansion)
Full Size Image
|
Aquaculture could help to lessen pressure on wild fish; but with annual growth rates of almost 8% (260% between 1992 and 2009), equaling now more
than half of the total wild fish catch, it is often negatively impacting the environment (via loss of mangroves, poor fish-waste management, influx of
antibiotics and other reasons) (FAO 2011). Nearly 90% of global aquaculture is practiced in Asia, the vast proportion of which occurs in China.
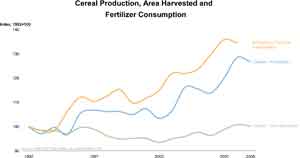
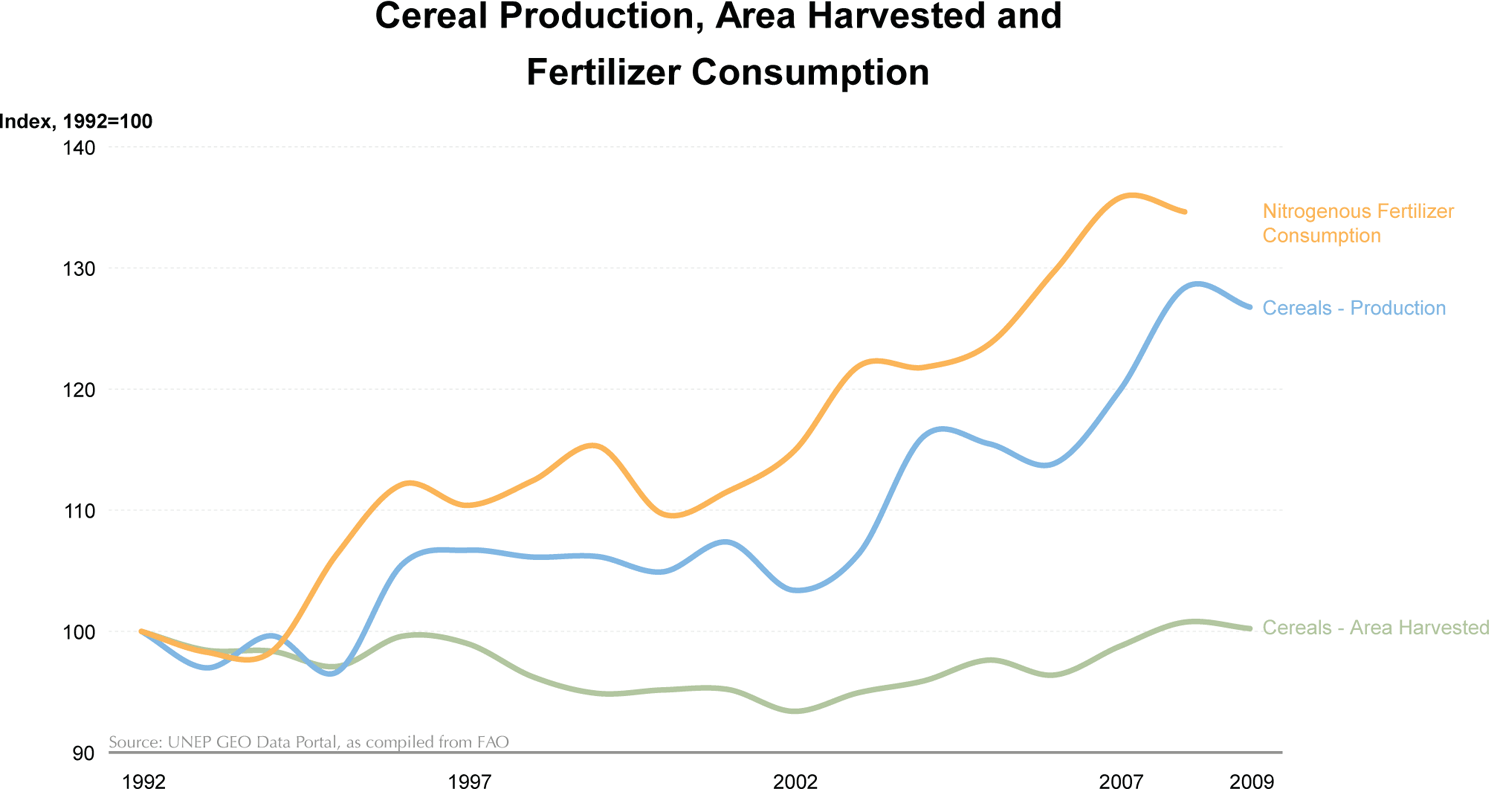
Figure 11: Higher agricultural yields depend heavily on the use of fertilizers
Full Size Image
|
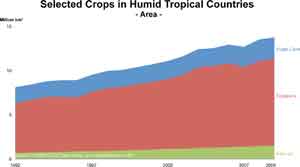
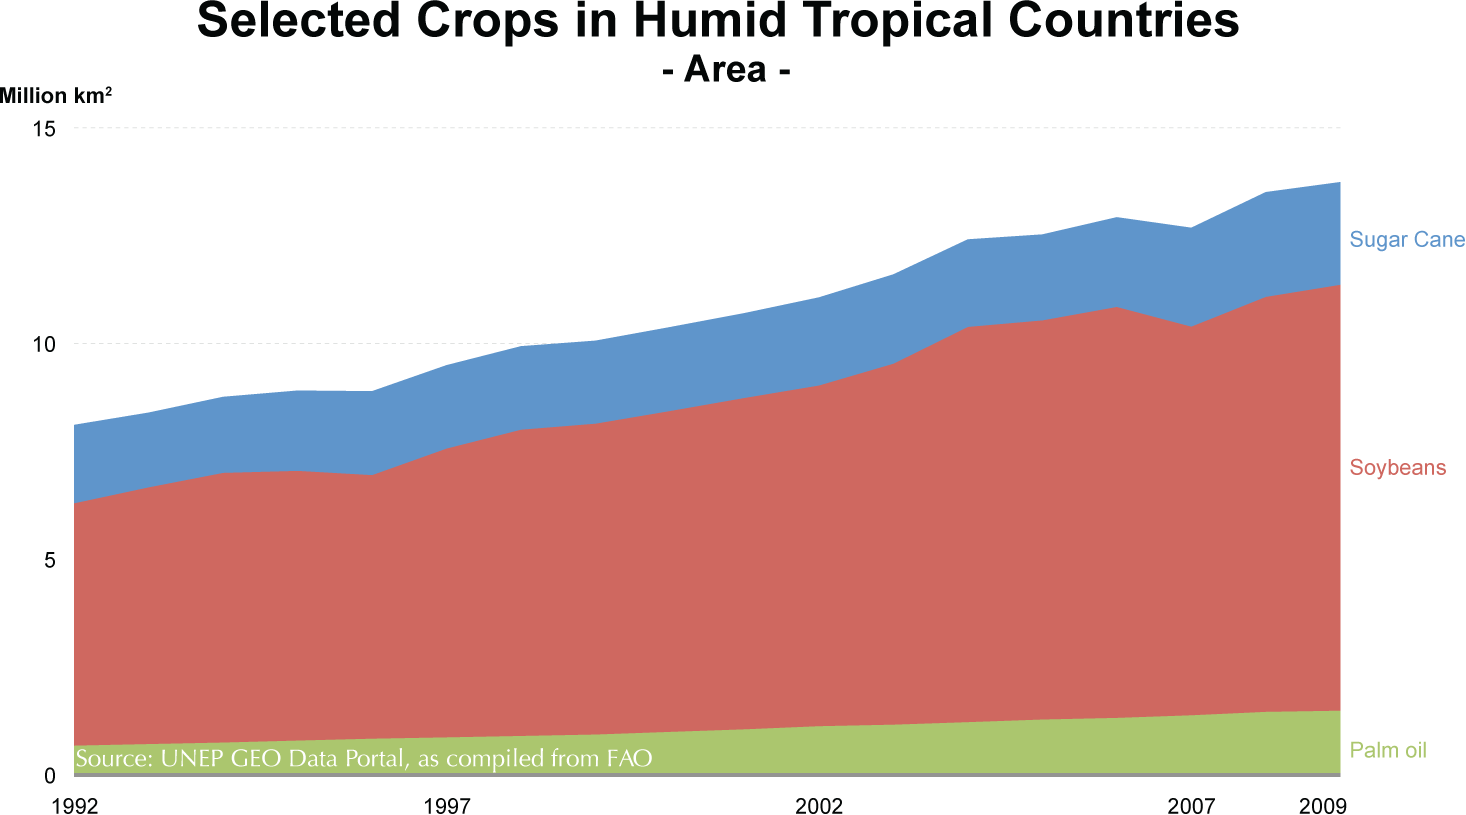
Figure 12: Three crops have expanded dramatically in the tropics, often replacing primary forests
Full Size Image
|
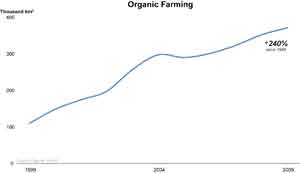
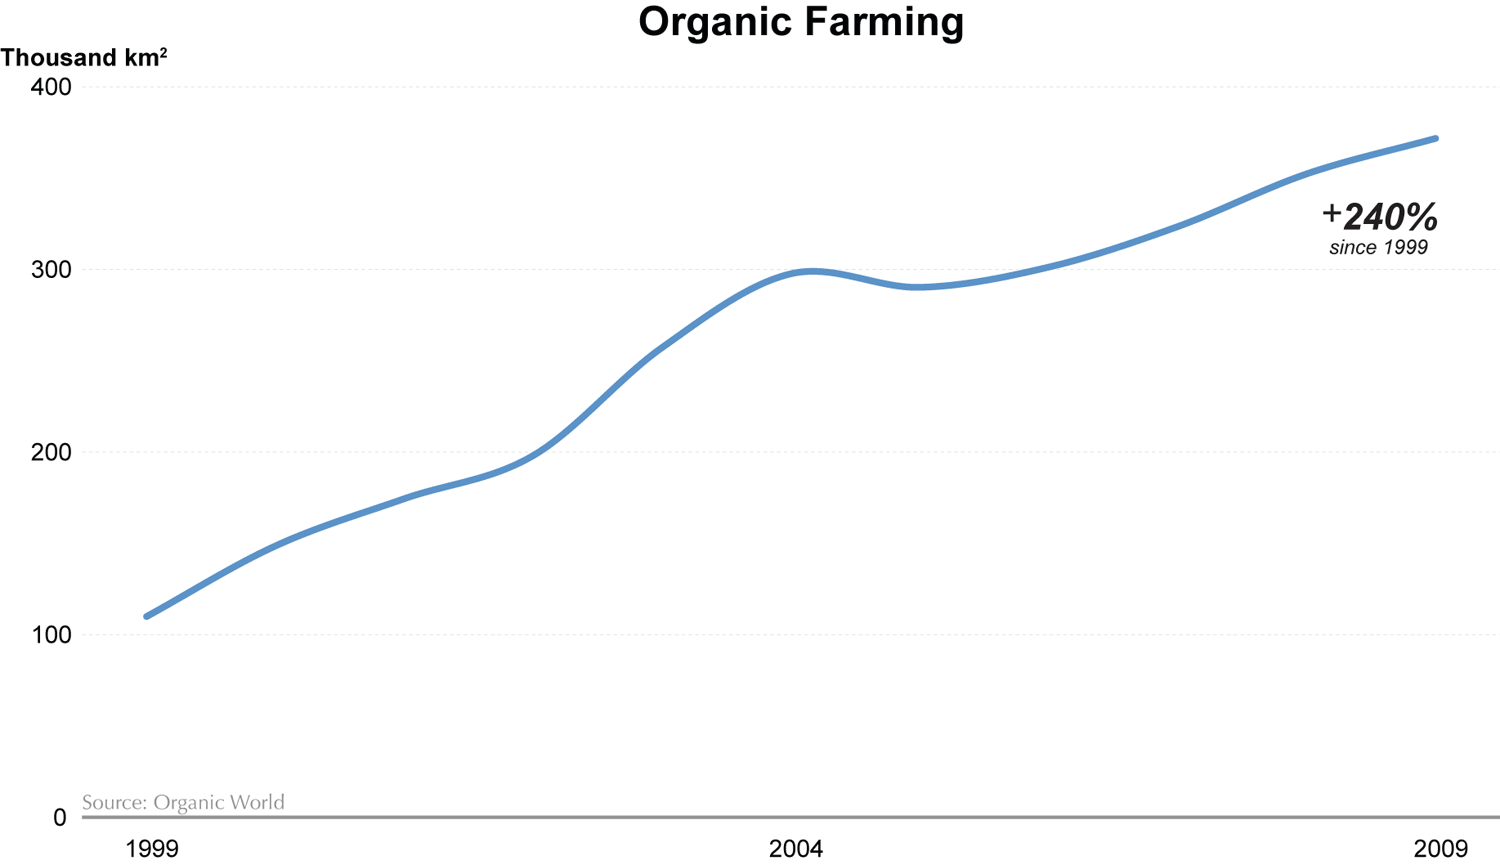
Figure 13: Land area used for organic farming is growing at an annual rate of nearly 13%
Full Size Image
|
In parallel to growing production of fish, the production of other livestock and crops has been rising steadily - 45% between 1992 and 2009 - at a pace
nearly two times higher than that of population (26%). The higher yields in cereals, however, are only marginally linked to the total area under
cultivation, but depend almost exclusively on intensification, where use of fertilizers plays a major role (UNEP 2011c), along with increasing irrigation.
While the latter have expanded steadily (21% since 1992), it accounts for approximately 70% of total freshwater withdrawals worldwide (UNESCO 2001), it
puts further pressure on already scarce and partially rapidly decreasing freshwater availability. While a few selected crops (such as sugar cane,
soybeans and palm oil) have dramatically expanded in the tropics (+70% between 1992 and 2009) with negative impacts on natural ecosystems, ever-increasing
numbers of grazing animals, especially goats (+45% since 1992), degrade already impoverished grasslands in semi-arid climates. Organic farming, as an
alternative approach to the (over)use of natural resources, heavy machinery and chemical fertilizers has been greatly expanding (240% between 1999 and 2009),
but nevertheless represents less than 1% of the global agricultural land.
The Good News
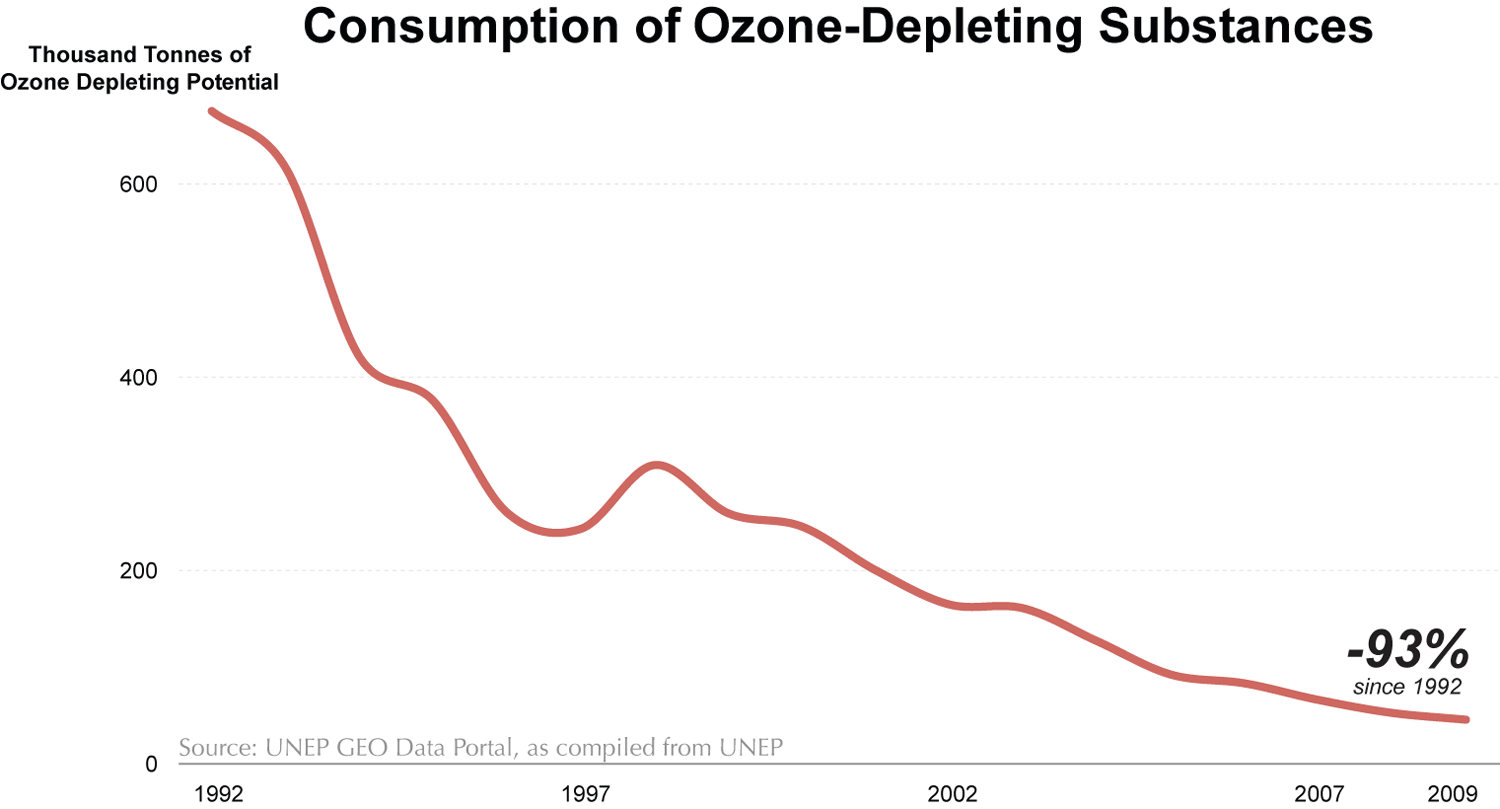
Nonetheless, there are some signs of positive change as well. As concern about the ever-increasing CO2 emissions and their environmental impacts
rises, the Montreal Protocol, responsible for the phasing-out of ozone-depleting substances (ODS), showcases how an international agreement can lead to
success, with a decline of 93% in the consumption of ODS between 1992 and 2009. The "perhaps single most successful international agreement" (Kofi Annan)
not only helps to protect the Ozone layer, but leads to substantial co-benefits by reducing climate change, as many ODS are at the same time potent
greenhouse gases (WMO/UNEP 2010).
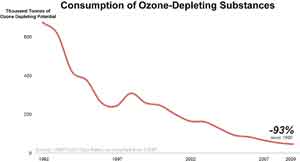
Figure 14: Thanks to the participation and commitment of nearly all countries (195 in 2011), the Montreal Protocol is
perhaps the "single most successful international agreement to date" (Kofi Annan, former UN Secretary-General)
Full Size Image
|
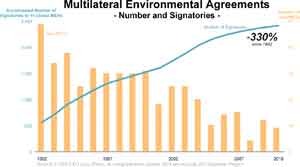
Figure 15: Numerous international agreements were negotiated in the two decades following the Rio Conference in 1992
Full Size Image
|
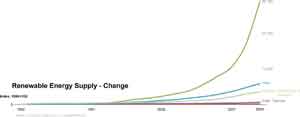
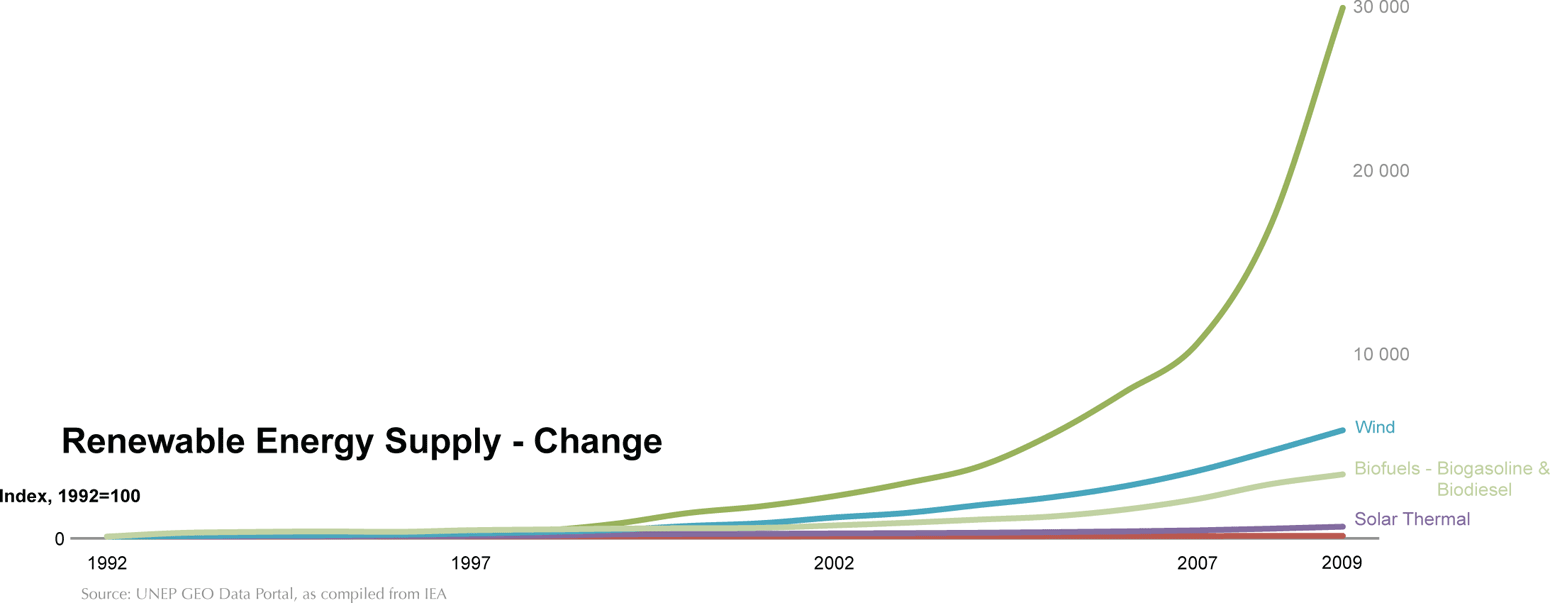
Figure 16: Renewable energy resources (including biomass) currently account for 13% of global energy supply. Solar and wind energy,
though with steep growth rates, account for only 0.3% of global energy supply
Full Size Image
|
The number of Multilateral Environmental Agreements rose by 330% between 1992 and 2010, demonstrating political recognition of environmental issues. On
the side of the private sector, environmental management standards are increasingly recognized, as the adoption of the ISO 14000 standard, which codifies
practices and standards to minimize harmful impacts on the environment and achieve environmental performance - an increase of 1500% between 1999 and 2009.
Investments in sustainable energy have skyrocketed in recent years, with an increase of 540% between 2004 and 2010, reaching US$ 2011 thousand million.
For the first time, new investment in utility-scale renewable energy projects and companies in developing countries surpassed that of developed economies
(UNEP 2011d). Along with this, renewable energy supply has seen staggering increases (+30000% for solar photovoltaics, +6000% for wind between
1992 and 2009), although solar and wind energy account for only 0.3% of the global energy supply. Including water and especially biomass (wood, dung),
renewable energy comprised 16% of the global energy supply in 2010. Trading in CO2 emissions has grown rapidly (+1200% between 2005 and 2010), but due
to only partial implementation and lack of clarity about future regulations in a post-Kyoto regime, the mechanisms are today suffering rather large
losses in value.
The need for improved monitoring and environmental data
With limited progress on environmental issues achieved, and few real "success stories" to be told, all components of the environmentland,
water, biodiversity, oceans and atmosphere continue to degrade. Notwithstanding great advances in information and communication technologies, we have not
made such breakthroughs when it comes to assessing the state of our environment. Until we apply the same dedication to this issue as we have to other
areas, data gaps and inadequate monitoring will continue to hinder sound 'evidence-based policy-making.'
The need to focus attention and resources on improved monitoring and environmental data collection at all levels is essential in
order to provide reliable and relevant information for decision-making. A new commitment to deal with persistent environmental problems and emerging
issues calls for cooperation, flexibility and innovative solutions.
Acknowledgment
Written by: Stefan Schwarzeraa
Production and Outreach Team: Arshia Chanderb, Bruce Pengrab, Erick Litswac, Kim Gieseb,
Michelle Anthonyb, Reza Hussainb, Theuri Mwangic
(a UNEP GRID Geneva, b UNEP GRID Sioux Falls, c UNEP GRID Nairobi)
References
Bindoff, N. , Willebrand, J., Artale, V. and others (2007). Observations: Oceanic
Climate Change and Sea Level. In Averyt, K., Chen, Z., Manning and others. Climate Change 2007: The Physical Science Basis. Contribution of
Working Group I to the Fourth Assessment Report of the Intergovernmental Panel on Climate Change. Cambridge University Press. Cambridge
Caldeira, K. and Wickett, M. (2003). Anthropogenic Carbon and Ocean pH. Nature 425, 365
Collette, B., Carpenter, K. , Polidoro, B. and others (2011). High Value and Long LifeDouble Jeopardy
for Tunas and Billfi shes. Science DOI: 10.1126/ science.1208730
FAO (2010). Global Forest Resources Assessment 2010. Food and Agriculture Organization, Rome
FAO (2011). The State of World Fisheries and Aquaculture 2010. Food and Agriculture Organization, Rome
Feely, R., Doney, S. and Cooley, S. (2009). Ocean Acidifi cation: Present Conditions and Future Changes in a
High-CO2 World. Oceanography 22(4), 3647
Hansen, J., Sato, M., Ruedy and others (2006). Global Temperature Change. PNAS 103(39), 14288-14293
IPCC (2007). IPCC Fourth Assessment Report: Climate Change 2007: The Physical Science Basis.
Intergovernmental Panel on Climate Change, New York
IUCN (2011). Increased Protection Urgently Needed for Tunas. International Union for Conservation of Nature.
Accessed on Aug 9, 2011 at http://www.iucn.org/ knowledge/news/?7820
IUCN/UNEP (2011). The World Database on Protected Areas (WDPA). International Union for Conservation of Nature.
United Nations Environment Programme. Accessed on July 11, 2011 http://www.protectedplanet.net
JMA (2011). Global Temperature in 2010. Tokyo Climate Center News Tokyo climate Center. Japan Meteorological
Agency. Accessed on Mar 23, 2011 at http:// ds.data.jma.go.jp/tcc/tcc/news/tccnews23.pdf
NASA (2011). NASA Research Finds 2010 Tied for Warmest Year on Record. National Aeronautics and Space
Administration. Accessed on Mar 23, 2011 at http://www.giss.nasa.gov/research/news/20110112/
NOAA (2011). State of the Climate: Global Analysis for Annual 2010, published online
December 2010. Accessed on August 18, 2011 at http://www.ncdc. noaa.gov/sotc/global/2010/13
Toropova, C., Meliane, I., Laffoley, D., Matthews, E. and Spalding, M. (eds.) (2010).
Global Ocean Protection: Present Status and Future Possibilities. Brest, France: Agence des aires marines protégées, Gland, Switzerland, Washington,
DC and New York, USA: IUCN WCPA, Cambridge, UK : UNEP-WCMC, Arlington, USA: TNC, Tokyo, Japan: UNU, New York, USA: WCS. 96pp
UCSUSA (2011). Deforestation Today: Its Just Business. Union of Concerned
Scientist USA. Accessed on Jul 10, 2011 at http://www.ucsusa.org/global_ warming/solutions/forest_solutions/deforestation-today-business.html
UK-MetOffice (2011). 2010 A Near Record Year. Accessed on Mar 23, 2011
at http://www.metoffice.gov.uk/news/releases/archive/2011/2010-global- temperature
UN (2011). Composition of macro geographical (continental) regions, geographical sub-regions,
and selected economic and other groupings. Accessed on Feb 10, 2012 at http://unstats.un.org/unsd/methods/m49/m49regin.htm
UNEP (2010). UNEP Emerging Issues: Environmental Consequences of Ocean Acidifi
ciation: A Threat to Food Security. United Nations Environment Programme, Nairobi
UNEP (2011). Keeping Track of Our Changing Environment. United Nations Environment Programme.
DEW/1234/NA. Nairobi (Kenya)
UNEP (2011b). UNEP Yearbook 2011. United Nations Environment Programme, Nairobi
UNEP (2011c). Decoupling Natural Resource Use and Environmental Impacts from Economic Growth.
United Nations Environment Programme, Paris
UNEP (2011d). Towards a Green Economy: Pathways to Sustainable Development and Poverty
Eradication - A Synthesis for Policy Makers. United Nations Environment Programme, St-Martin Bellevue
UNESCO (2001). Securing the Food Supply, World Water Assessment Program. United
Nations Educational, Scientific and Cultural Organization
van der Werf, G. R. , Morton, D. C., DeFries, R. S., Olivier, J. G. J., Kasibhatla,
P. S., Jackson, R. B., Collatz, G. J. and Randerson, J. T. (2009). CO2 Emissions from Forest Loss. Nature Geoscience 2, 737-738
WGMS (2010). Glacier Mass Balance Data 1980-2009. World Glacier Monitoring
Service, Zurich, Switzerland. Accessed on Aug 17, 2011 at http://www.wgms.ch
WMO/UNEP (2010). Scientific Assessment of Ozone Depletion 2010. World
Meteorological Organization. United Nations Environment Programme, Nairobi
If you no longer wish to receive this bulletin you can unsubscribe anytime.
Information is regularly scanned, screened, filtered, carefully edited, and published for educational purposes. UNEP does not accept any liability
or responsibility for the accuracy, completeness, or any other quality of information and data published or linked to the site. Please read our
privacy policy and
disclaimer for further information.
|


