|
Having trouble reading this email? Download the PDF.

IN THIS ISSUE
 |
Nine of the ten hottest years on record all in the last decade
Four of the worlds leading climate research centres agree that the 10 hottest years on record have all occurred since 1998. These data and findings for 2010 add weight to the
common conclusion that the clear, long-term trend is one of global warming.
|
Thematic Focus: Climate Change
Nine of the ten hottest years on record all in the last decade
Why is this issue important?
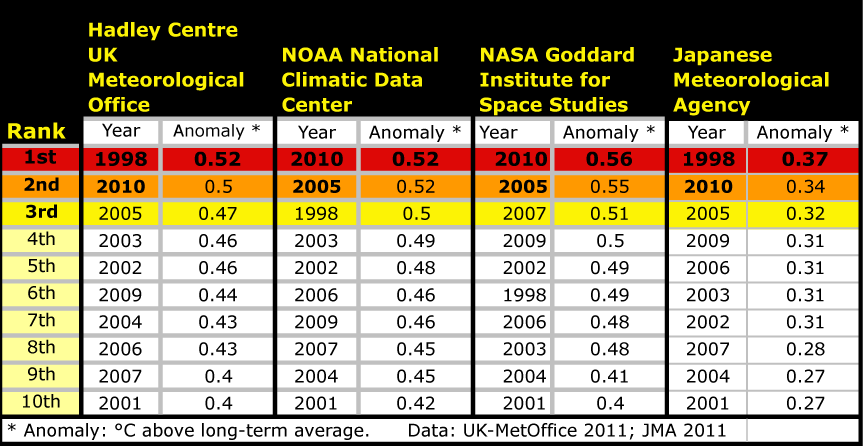
Four of the worlds leading climate research centres agree that the 10 hottest years on record have all occurred since 1998 (Table 1) (NOAA 2011, NASA 2011, UK-MetOffice 2011, JMA 2011).
Two of the centres, the National Climatic Data Center (NCDC) and Goddard Institute for Space Studies (GISS), show 2010 to be tied for the hottest year in the instrumental record
(NOAA 2011, NASA 2011). Two other leading analyses from the UK's Hadley Centre and the Japanese Meteorological Agency (JMA) both show 2010 to be second warmest (only 0.02ºC and 0.03 ºC
respectively cooler than 1998) (UK-MetOffice 2011, JMA 2011). These data and findings for 2010 add weight to the common conclusion of all four agencies and most of the scientific
community, that in spite of short-term spatial and temporal variability the clear long-term trend is one of global warming (NOAA 2011, NASA 2011, UK-MetOffice 2011, JMA 2011).
Table 1: The ten hottest years on record have all occurred since 1998 according to rankings from four top US, British and Japanese climate research centers.
Full Size Image
The global annual mean surface temperature used for these rankings is calculated from a historical record drawn from roughly 7 000 meteorological stations and compiled by the Global
Historical Climatology Network (Hansen and others 1999, Peterson and Vose 1997). Data are generally shown as departure from a baseline global mean temperature; National
Aeronautics and Space Administration's (NASA) Goddard Institute
for Space Studies uses 1951 to 1980 for its baseline. In any given year, there are both areas cooler and areas warmer than this baseline. The temperature averaged for the entire
globe is the global mean temperature. Changes in this global mean relative to the baseline period (both figures calculated with the same methods) show the trend in global mean temperature.
Extensive work has been done by researchers to check the estimates for bias introduced by proximity to urban heat islands (Hansen and others 2010), uneven distribution of weather stations
(Hansen and Lebedeff 1987), different methods of extrapolating anomalies (Hansen and others 2010), and interpolation of ocean-based measurements (Rayner and others 2003). Even the
height of the decks of ships from which measurements were taken has been considered and incorporated into the estimates (Rayner and others 2003). The longer the data record becomes
and the more refinements in methods used to calculate global mean temperature, the more certainty researchers have about the observed trends.
The graph (below) shows global mean temperature over the past 130 years modeled from station temperature data by the four climate research centres (160 years in the
case of the Hadley Centre). The long-term trend is quite apparent and, in spite of popular misconception to the contrary, the rate of warming has not declined
(Hansen and others 2010). Using only a shorter view of the temperature record,
such as 1940-1970, would yield a very different conclusion. While these four climate centres all rely on the same collection of historical weather station readings, each uses different
methods to arrive at their final results. Agreement between the four centres' results (see Figure 1) in spite of varying methodologies reinforces their individual conclusions that the
warming-trend signal is clear. In addition, a separate collection of station temperature data initiated in the former Soviet Union and analysed at Oak Ridge National Laboratory
produced very similar results (Lugina and others 2006).
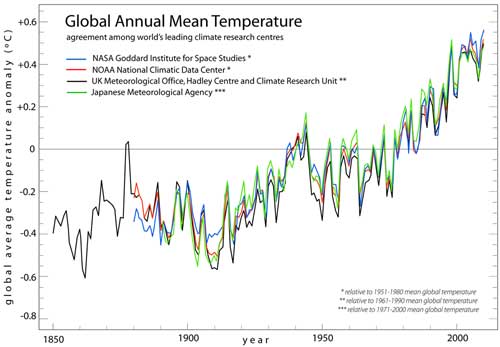
Figure 1: The long-term trend of warming is clear in the results of all four leading climate research centres. A high degree of agreement year
by year occurs in spite of the different methodologies used. Source: Redrawn by UNEP-GRID Sioux Falls, from UK MetOffice 2011 and JMA 2011
Full Size Image
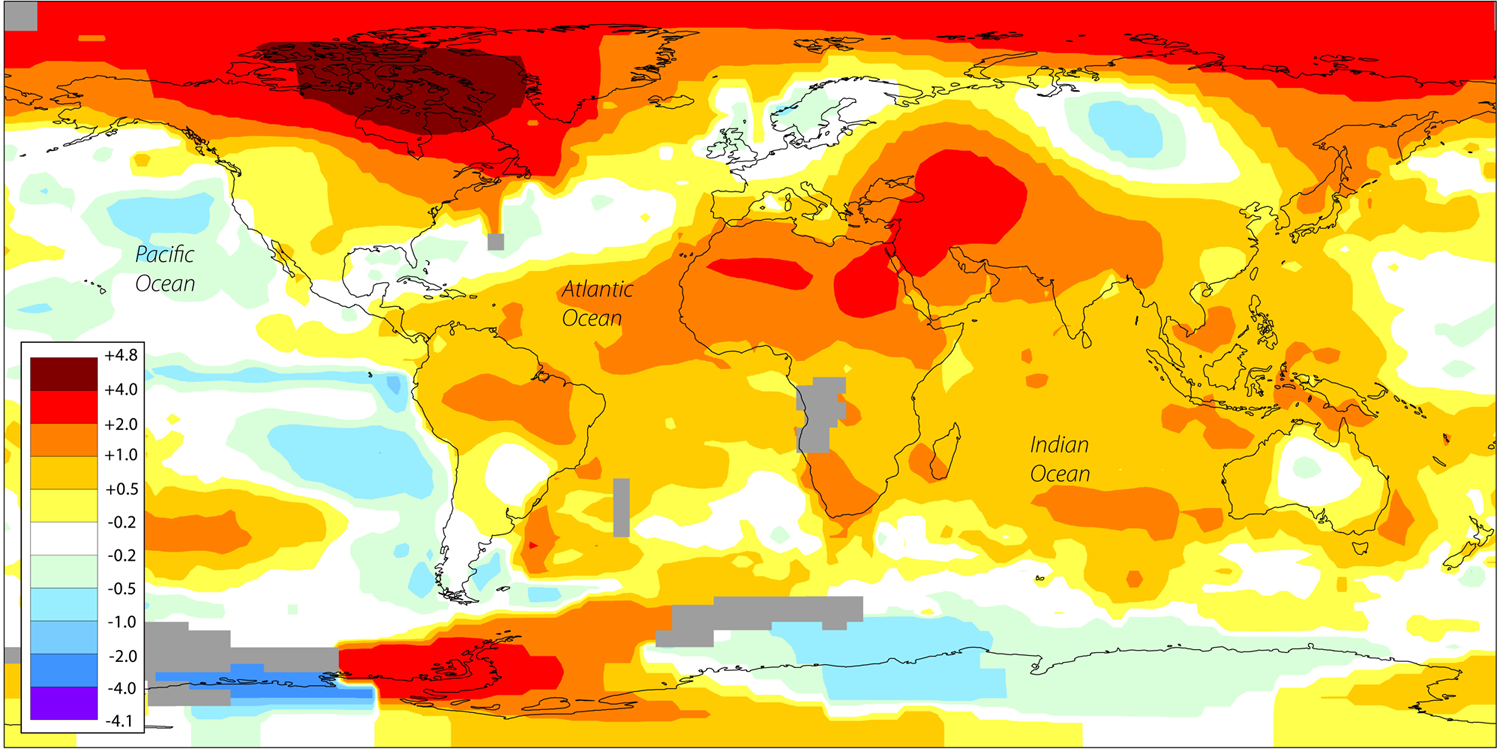
The most extreme warming for 2010 can be seen at the northern extremes of North America and in general across the high north latitudes (Figure 2a). Anomalies in 2010 mean temperature
averaged across zones of latitude show a heavy concentration beginning above 60 degrees north latitude (Figures 2 and 3). This same pattern of anomalies is prominent in the maps for the two
next-hottest years 2005 and 1998 (Figure 2b) (NASA-GISS 2011) and in maps of mean temperature change from 1900-2009 (Hansen and others 2010). The greater warming occurring at northern
latitudes is mirrored by the trend of annual minimum arctic sea ice (NSIDC 2010). Researchers have modeled the impact of this warming on arctic permafrost and believe that it may initiate a
feedback which would accelerate warming (Schaefer and others 2011).
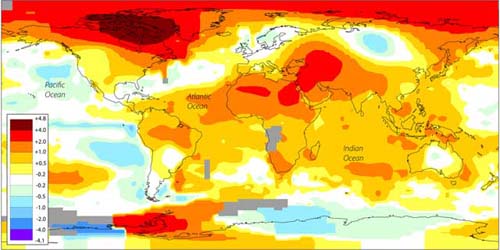
Figure 2a Full Size Image
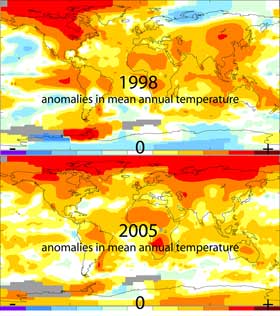
Figure 2b Full Size Image
Figures 2a and 2b: Global warming is not uniform across the Earth's surface. A map of 2010 mean annual temperature anomalies shows
the greatest departure from the 30 year baseline (1951-1980) in the northern latitudes as do maps from the next hottest years: 1998 and 2005 (Figure 2b).
Data: NASA-GISS Graphic: UNEP GRID Sioux Falls
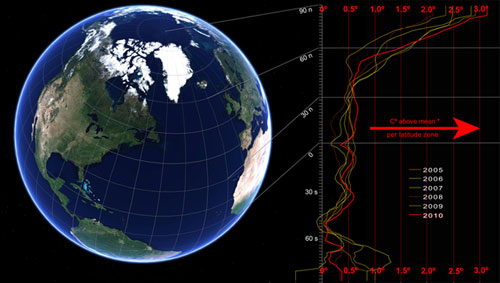
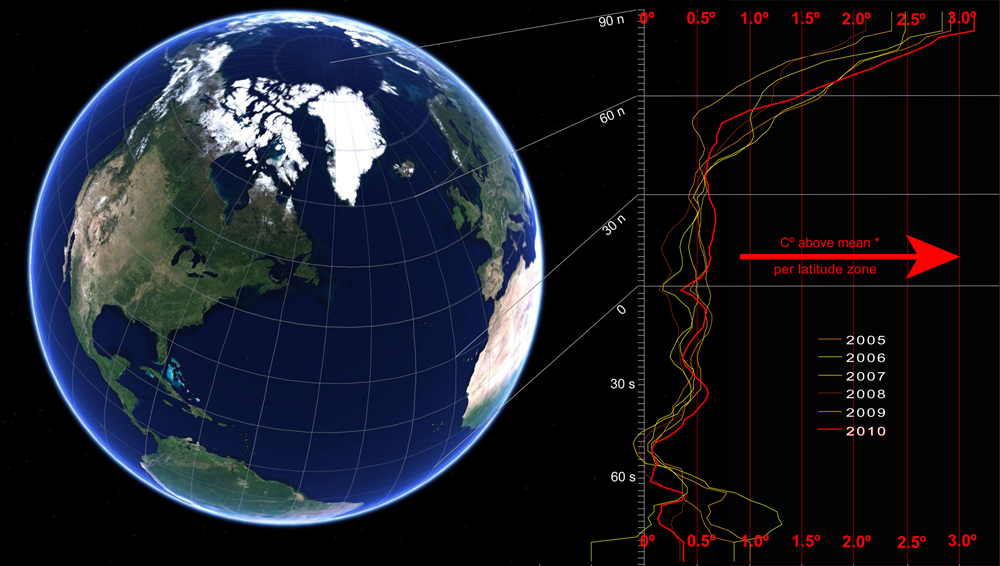
Figure 3: The warming of global mean temperature is not occurring uniformly across the globe's latitude zones. This graph of departure from
the historical mean temperature (1951-1980) for the past six years breaks down this variation by latitude. Extreme northern latitudes are seeing the most extreme
change in temperature. Data: NASA-GISS, Graphic: UNEP GRID Sioux Falls
Full Size Image
Public Perception of Global Warming
The spatial and temporal variability of these warming anomalies has an impact on public perception of the climate change issue (Hansen and others 2010). The direct
observation of recent warming in the Arctic is limited to a relatively small portion of world population. Temporal variability, over timeframes of a few years or even decades,
masks the longer-term trend and can even create the impression of a reversal of the long-term warming trend (Figure 1). Viewing the longer record of temperature is necessary
to ascertain a reliable understanding of the more important long-term trend. Similarly, a limited spatial view of the data can produce a very different picture than a global view.
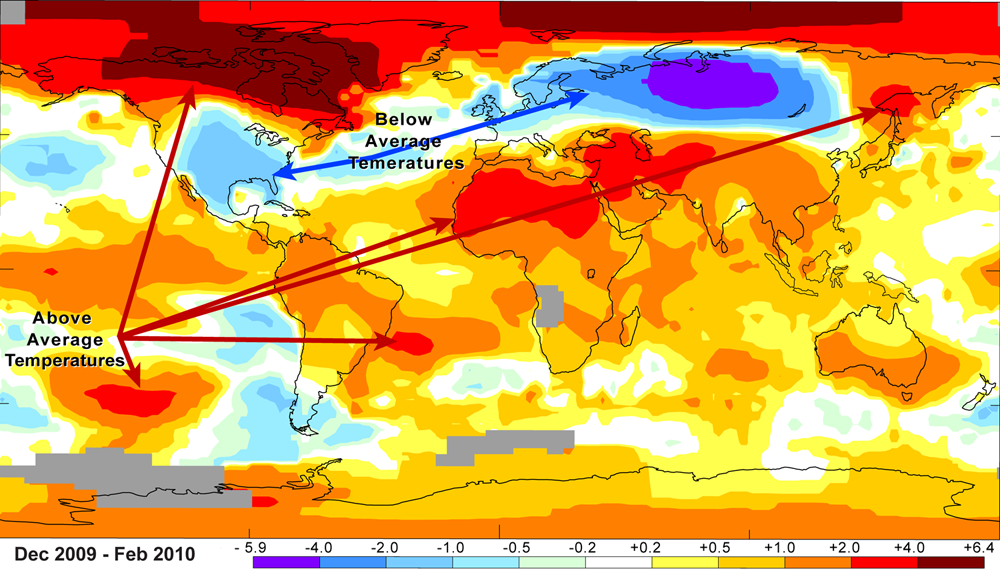
For example, during the winter of 2009-2010 most of North America and much of Northern Europe were cooler than the long-term mean temperature (Figure 4). This again masked the
broader reality of overall warmer temperatures globally to those living in these two influential areas. The complexity of climate science makes it difficult to explain to a broad
public via mass media. Recent polls in Britain (taken following this cold snap) showed a decline in the number of adults who believe that the global climate is changing—from
91 per cent in 2005 to 78 per cent in early 2010 (Spence and others 2010, BBC 2010).
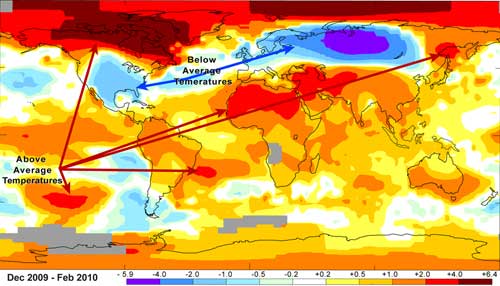
Figure 4: The cooler than average temperatures in North America and Northern Eurasia in the winter of 2009-2010 were the exception.
However, some people experiencing the cold in these influential areas took this as evidence against global warming. Data: NASA-GISS, Graphic: UNEP GRID Sioux Falls
Full Size Image
It is part of the responsibility of specialists in climate change to translate climate research so that the media, the public and policy makers can understand it.
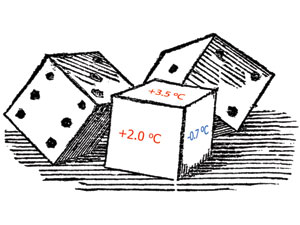
In an effort to explain uncertainty as applied in scientific climate modelingas differentiated from simply being uncertainDr. James Hansen of NASA used an analogy of
loaded dice (ODonnell 2000). He explains that if a pair of dice is thrown 100 times and comes up double sixes half of the time it would be clear that the dice are "loaded"
or weighted to increase the odds of sixes. Yet, there is uncertainty that the next throw of the dice will turn up double sixes. Similarly, the past 130 years of climate data
have more years of warming than of cooling. Nevertheless, in any given year there is no certainty that it will be warmer than the last year. However, as the climate record lengthens
year after year and the warming pattern persists or even accelerates more warm years this decade than last for example the long term trend becomes increasingly certain. Hansen
extends that analogy to saying that he believes the dice will become progressively more "loaded" in the coming years toward more and more warm years.
The 2010 data is one more "double six" in the 130 year climate record. The trend of global warming continues unabated according to the worlds leading climate research centres.
At the same time public perception of the issue and the will among policy makers to take action does not seem to be keeping pace (PRC 2009, Borick and others 2011, Spence and
others 2010). If solid science is to be the basis for sound policy it is imperative that policy makers and the public understand that science. While the complexity of climate
science makes responsible simplification for a non-specialist audience challenging, there is a clear and pressing need to meet that challenge.
References
BBC (2010) Climate scepticism on the rise, BBC poll shows. http://news.bbc.co.uk/2/hi/science/nature/8500443.stm (Last accessed on March 31, 2011).
Borick, C., Lachapelle, E. and Rabe, B. (2011) Climate Compared: Public opinion on climate change in the United States and Canada. The Center for Local, State, and Urban Policy
of the Gerald Ford School of Public Policy at the University of Michigan Muhlenberg College Institute of Public Opinion.
http://closup.umich.edu/policy-reports/15/climate-compared-public-opinion-on-climate-change-in-the-united-states-and-canada/ (Last accessed on March 30, 2011).
Hansen, J. and Lebedeff, S. (1987) Global trends of measured surface air temperature. Journal of Geophysical Research 92(11): 13,345-13,372.
Hansen, J., Ruedy, R., Glascoe, J. and Sato, M. (1999) GISS analysis of surface temperature change. Journal of Geophysical Research 104:30,997-31,022.
Hansen, J., Ruedy, R., Sato, M. and Lo, K. (2010) Global Surface Temperature Change. Reviews of Geophysics. 48: RG4004.
JMA (2011) Global Temperature in 2010. Tokyo Climate Center News Tokyo climate Center, Japan Meteorological Agency.
http://ds.data.jma.go.jp/tcc/tcc/news/tccnews23.pdf (Last accessed on March 23, 2011).
Lugina, K., Groisman, P., Vinnikov, K., Koknaeva, V. and Speranskaya, N. (2006). Monthly surface air temperature time series area-averaged over the 30-degree latitudinal belts
of the globe, 1881 2005. In Trends: A Compendium of Data on Global Change. Carbon Dioxide Information Analysis Center, Oak Ridge National Laboratory, U.S. Department of Energy, Oak Ridge, Tenn., U.S.A.
NASA (2011) NASA Research Finds 2010 Tied for Warmest Year on Record. http://www.giss.nasa.gov/research/news/20110112/ (Last accessed on
March 23, 2011).
NASA-GISS (2011) GISS Surface Temperature Analysis Global Maps from GHCN Data. http://data.giss.nasa.gov/gistemp/maps/ (Last accessed on
March 23, 2011).
NOAA (2011) National Climatic Data Center, State of the Climate: Annual 2010 Report Global Analysis. Published online January 2011.
http://www.ncdc.noaa.gov/sotc/2010/13 (Last accessed on March 23, 2011).
NSIDC (2010) Arctic Sea Ice Reaches Annual Minimum Extent Arctic Sea Ice News and Analysis National Snow and Ice Data Center, Boulder Colorado. http://nsidc.org/arcticseaicenews/2010/091510.html
(Last accessed on April 5, 2011).
O'Donnell, T. (2000) Of loaded dice and heated arguments: Putting the Hansen-Michaels global warming debate in context. Social Epistemology
14(2/3):109-127.
Peterson T. and Vose, R. (1997) An Overview of the Global Historical Climatology Network Temperature Database. Bulletin of the American Meteorological Society 78(12):2837-2849.
PRC (2009) Fewer Americans See Solid Evidence of Global Warming: Modest Support for "Cap and Trade" Policy. Washington, D.C.: Pew Research Center for the People and the Press.
http://pewresearch.org/pubs/1386/cap-and-trade-global-warming-opinion (Last accessed on March 30, 2011).
Rayner, N., Parker, D., Horton, E., Folland, C., Alexander, L., Rowell, D., Kent, E. and Kaplan, A. (2003) Global analysis of sea surface temperature, sea ice, and night marine
air temperature since the late nineteenth century. Journal of Geophysical Research 108(14): 4407.
Spence, A., Venables, D., Pidgeon, N., Poortinga, W. and Demski, C. (2010). Public Perceptions of Climate Change and Energy Futures in Britain: Summary Findings of a Survey
Conducted in January-March 2010. Technical Report (Understanding Risk Working Paper 10-01). Cardiff: School of Psychology.
Schaefer, K., Zhang, T., Bruhwiler, L., Barrett, A. (2011). "Amount and timing of permafrost carbon release in response to climate warming."
Tellus, Series B: Chemical and Physical Meterology, February 2011: Online edition.
UK-MetOffice (2011) 2010 a near record year. http://www.metoffice.gov.uk/news/releases/archive/2011/2010-global-temperature (Last accessed on March 23, 2011).
Information is regularly scanned, screened, filtered, carefully edited, and published for
educational purposes. UNEP does not accept any liability or responsibility for the accuracy, completeness, or any other quality of information and
data published or linked to the site. Please read our privacy policy and
disclaimer for further information.
|


